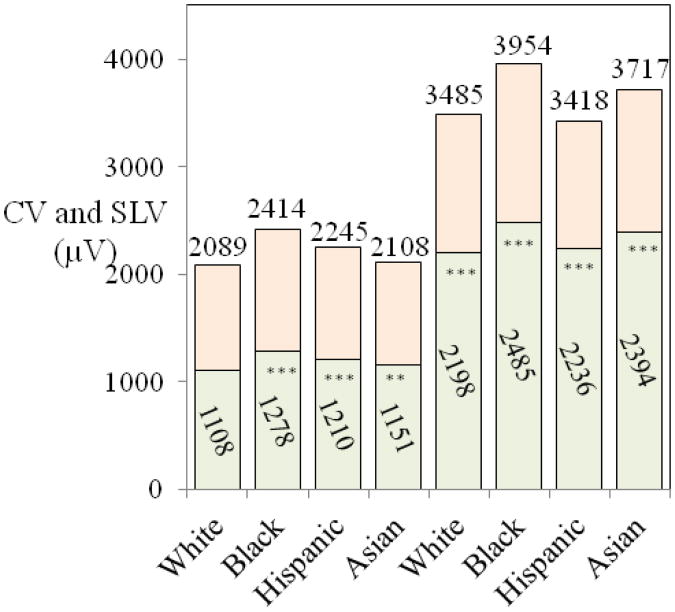
Figure 1.
Mean values (in lower columns) and upper normal limits (98th percentiles, listed on top for Cornell Voltage (CV) (four columns on the left) and Sokolow-Lyon Voltage (SLV) (four columns on the right) by ethnicity. The mean values and the upper limits in black, Hispanic and Asian women differ significantly from white women and race-specific upper normal limits are necessary.

