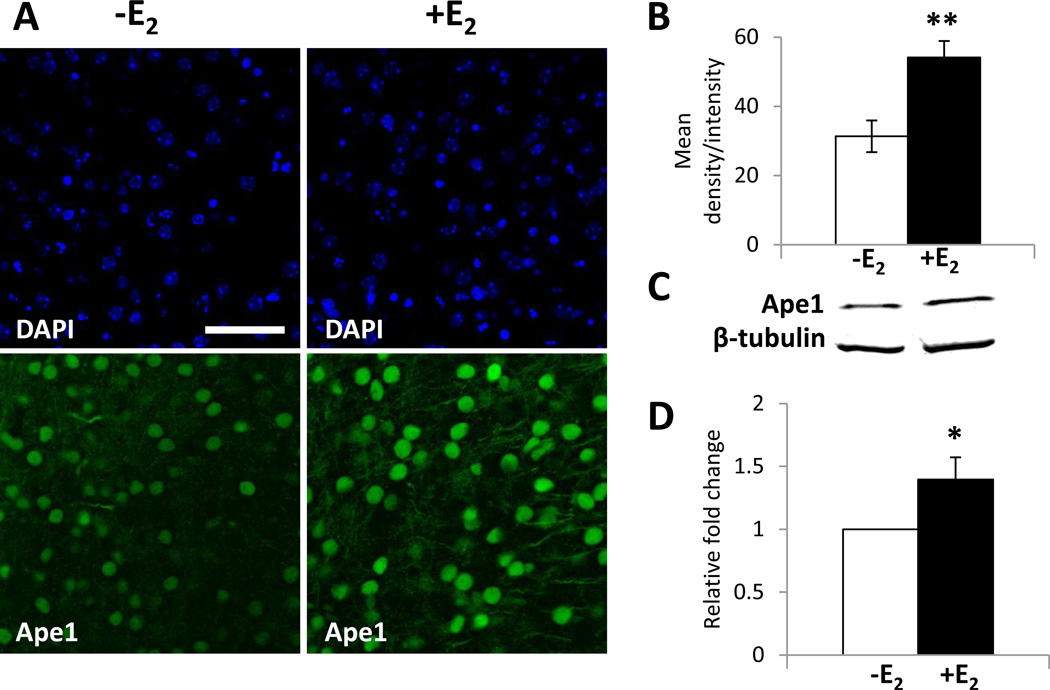
Fig. 3. E2 increases Ape1 expression in brain slice cultures.
Brain slice cultures were treated with ethanol or 20nM E2 for 24 h. (A) Immunofluorescent staining was performed using an Ape1-specific antibody. DAPI staining was included to identify cortical cell nuclei. Scale bar indicates 25 µm. (B) Image analysis of Ape1 expression from 6 individual ethanol- or 7 individual E2-treated brain slice cultures were combined and are expressed as the mean density/intensity ± SEM. (C) Whole cell extracts from brain slice cultures were prepared and quantitative Western blot analysis was performed using Ape1- and β-tubulin-specific antibodies. Ape1 expression was normalized to β-tubulin expression. (D) Data from 8 individual brain slice cultures were combined and are expressed as the normalized expression ± SEM. Ape1 expression from ethanol- or E2-treated brain slice cultures were compared using Student’s t test to determine statistical significance (* p < 0.05, ** p < 0.001).

