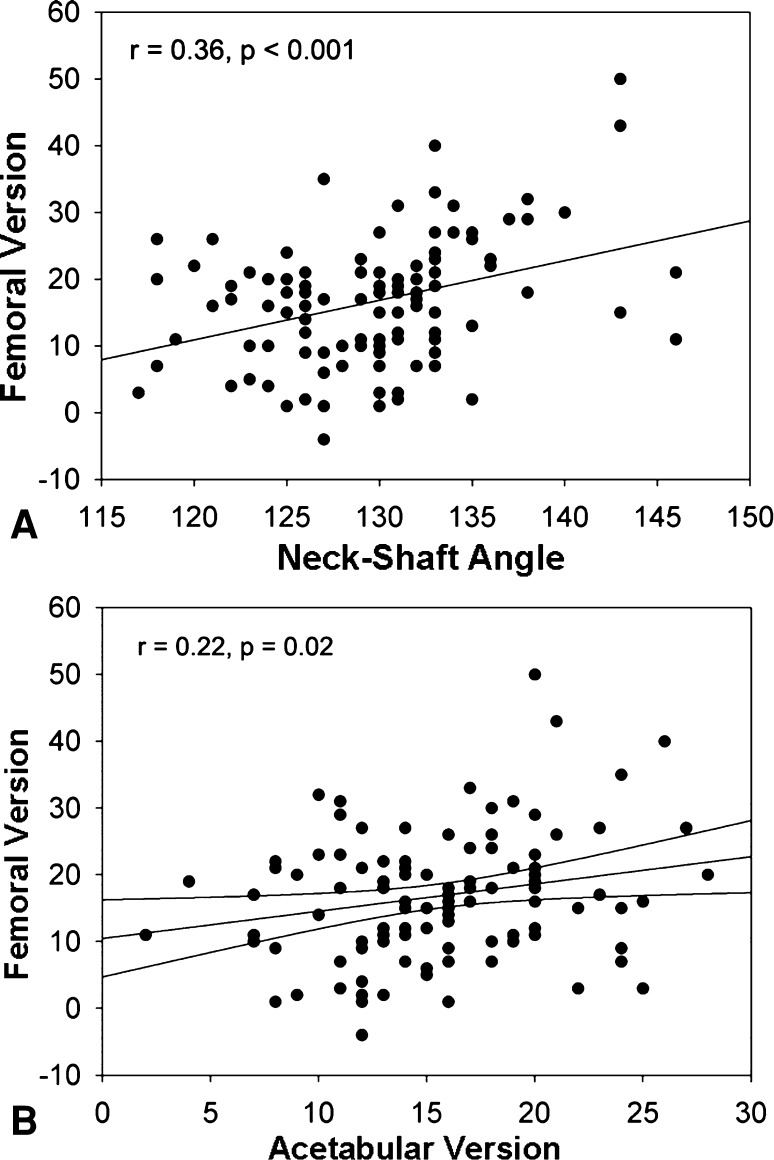
Fig. 5A–B.
(A) A scatterplot shows the association between femoral version and neck-shaft angle (r = 0.36, p < 0.001). Neck-shaft angle is a predictor of femoral version and explains 13% of the variance. (B) A scatterplot shows the weak association between femoral version and acetabular version (r = 0.22, p = 0.02). Femoral version explains 5% of the variance of acetabular version.

