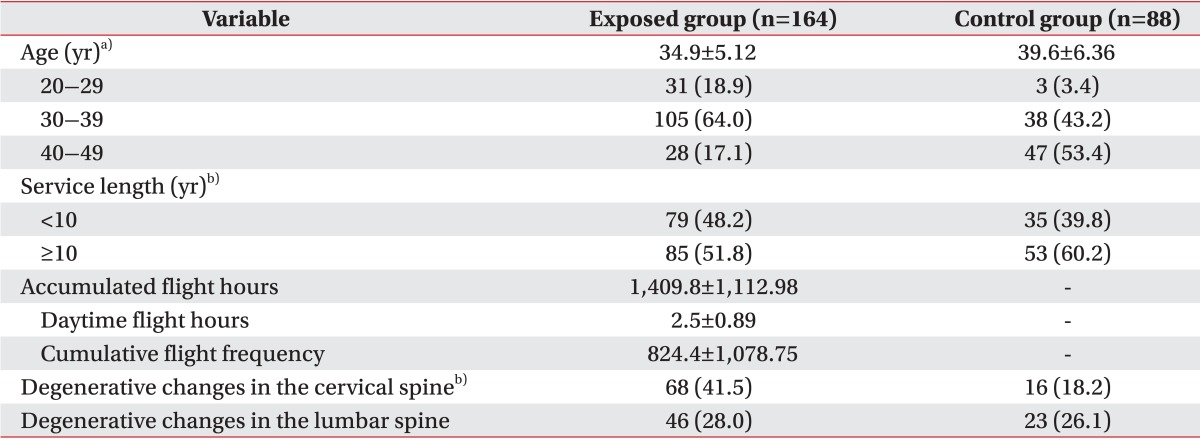
Table 1.
General and work-related characteristics and radiographic results for subjects

Values are presented as mean±standard deviation or number (%).
p<0.05 by a)Student t-test, b)chi-square test.
General and work-related characteristics and radiographic results for subjects

Values are presented as mean±standard deviation or number (%).
p<0.05 by a)Student t-test, b)chi-square test.