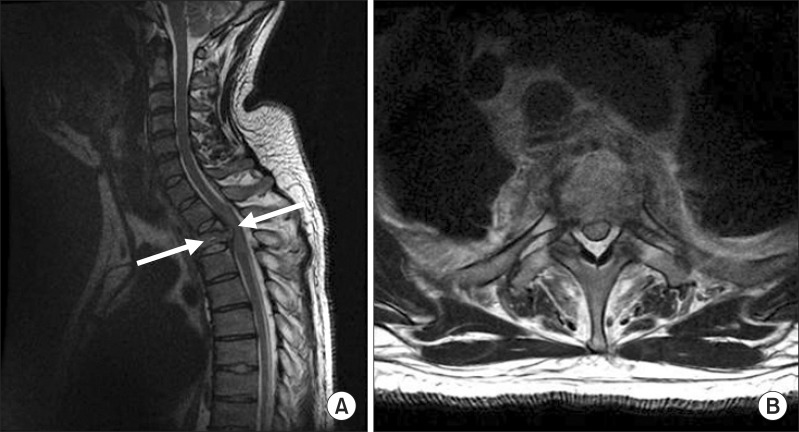
Fig. 2.
(A) Sagittal T2-weighted magnetic resonance image of the cervicothoracic spine showing collapsed T2 and T3 vertebrae (arrow), anterior and posterior epidural mass formation, causing compressive myelopathy at T2 to T4 level. (B) Axial T2-weighted magnetic resonance image between T2 and T3 level.

