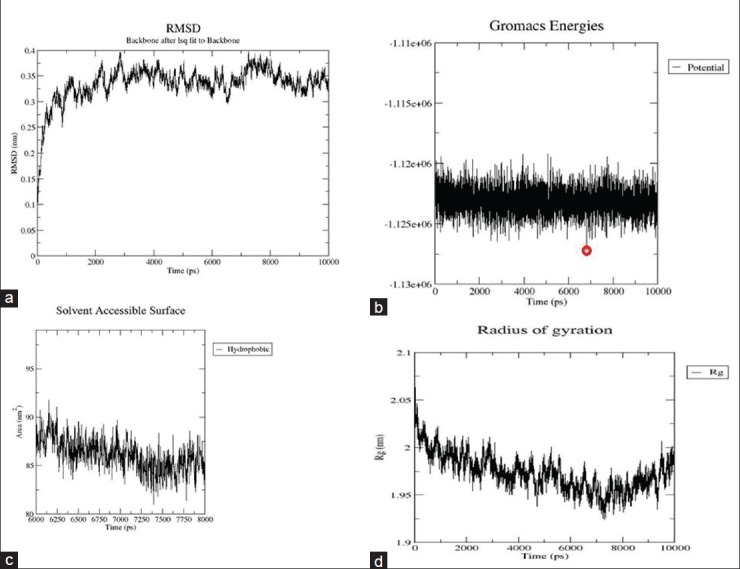
Figure 2.

(a) The RMSD graph, with deviation stabilizing close to 3.25Å at the end of 10ns. Overall deviation in rmsd over 10ns was observed close to 2.25Å. X-axis shows time in ps and Y-axis indicates RMSD in nm. (b) potential energy graph over 10ns. The lowest potential energy was noted at 6820ps, marked with a red circle. X-axis shows time in ps and Y-axis indicates potential energy value in kJ/mol. (c) Solvent-accessible surface graph, showing the drop in hydrophobicity near the structure with lowest potential energy. X-axis shows time in ps and Y-axis indicates Area in nm. (d) Radius of gyration graph, which drops in value by a good margin indicating the structure converging in shape acquiring compactness with time. X-axis shows time in ps and Y-axis indicates Radius of gyration in nm
