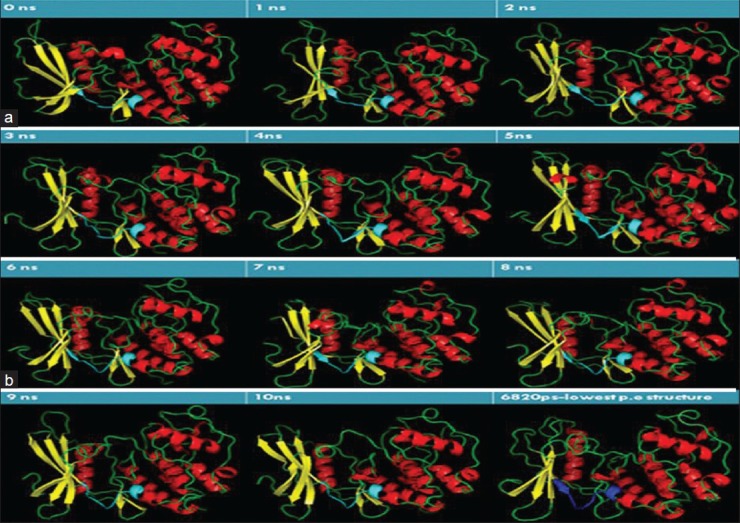
Figure 3.

(a) ATP-binding site cavity change observed over 5ns, with interval of 1ns. The binding site cavity (shown in Cyan) converges in shape over time. Helix is shown in red, yellow indicates sheets, and coil is shown in green color. (b) ATP-binding site cavity change observed 6-10ns, with interval of 1ns. The binding site cavity (shown in Cyan) converges in shape over time. The structure with lowest potential energy assumes a compact figure as shown. The ATP-binding site in the structure with lowest potential energy is shown in blue. Helix is shown in red, yellow indicates sheets, and coil is shown in green color
