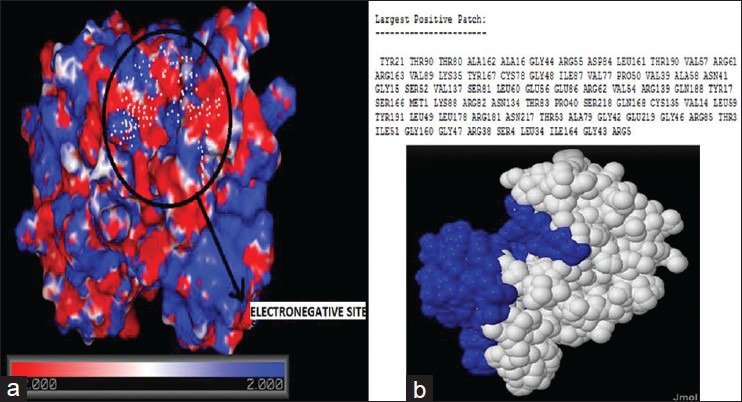
Figure 4.

(a) The electrostatic potential map generated using charmm force field using charm-gui. The region encircled in black shows the electronegative binding pocket. Different shades of red shows varying levels of electronegativity of the residues, white color indicates residues with neutral charge, and different shades of red shows varying levels of electropositivity of the residues. (b) the results of patch finder plus that displays the largest positive patch (indicated in blue) in the protein. The largest positive patch does not include the residues in the binding site
