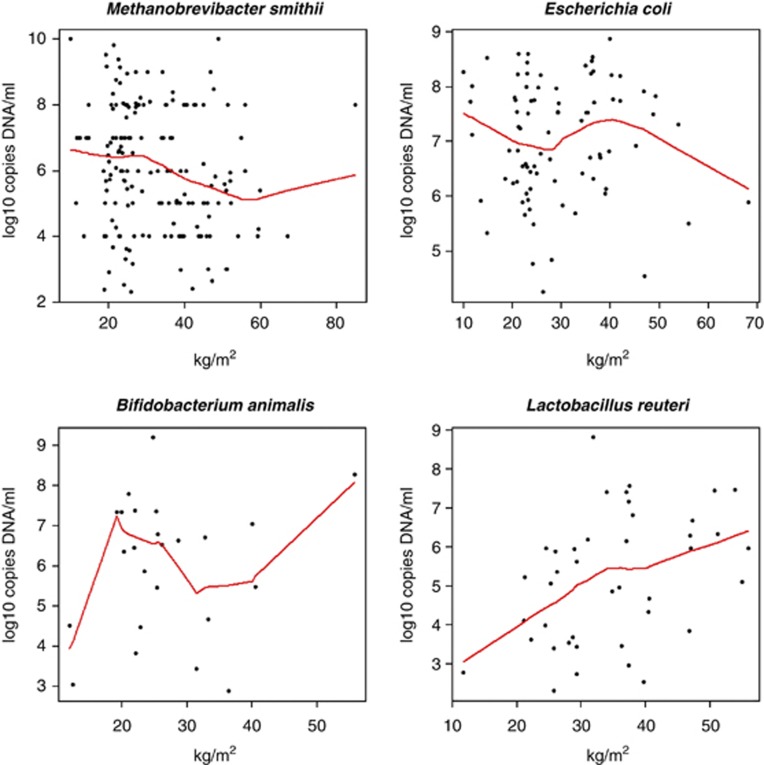
Figure 4.
Correlation between the BMI and specific bacterial clades. Plots represent analyses performed only on the carriers for each bacterial clade studied. Spearman correlation test: Methanobrevibacter smithii r=−0.20, P=0.01. Lactobacillus reuteri r=0.44, P=0.004. No correlation was found in the patients positive for E. coli (P=0.80) or Bifidobacterium animalis (P=0.99).

