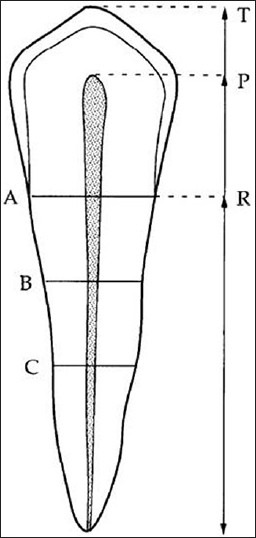
Figure 1.

Diagram showing tooth measurements according to Kvaal et al.: T, tooth length; R, root length on the mesial surface; P, maximum pulp length; A, root and pulp width at enamel–cementum junction (ECJ); B, root and pulp width midway between measurement levels A and C; C, root and pulp width midway between apex and ECJ
