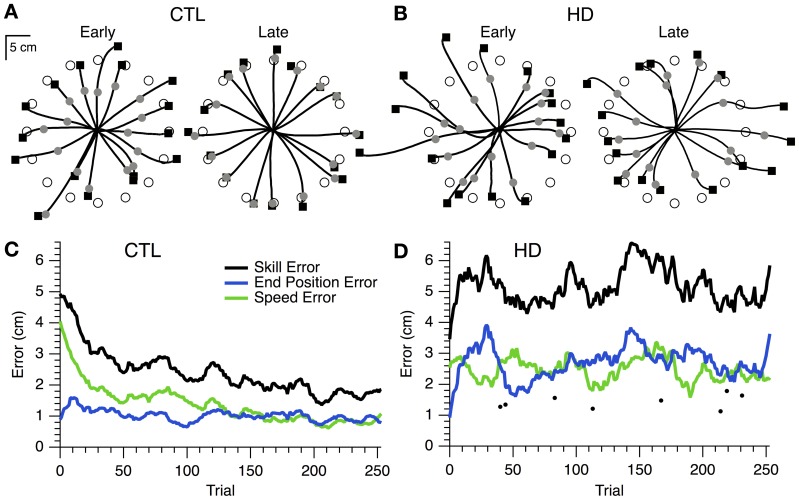
Figure 2.
Hand paths and time course of skill learning for representative single subjects. (A) Hand paths for a sample CTL subject with the positions of the timed discs (gray circles) and endpoint squares (black squares) shown. “Early” trials (i.e., the first 16 trials of training), left. “Late” trials (i.e., the last 16 trials of training), right. (B) Same plots as (A), but for a sample HD subject. (C) Smoothed skill error (black), endpoint error (blue), and speed error (green) vs. trial number for a sample CTL subject. (D) Same plot as (C), but for a sample HD subject. Single trial examples of skill error (filled circles) are also shown.

