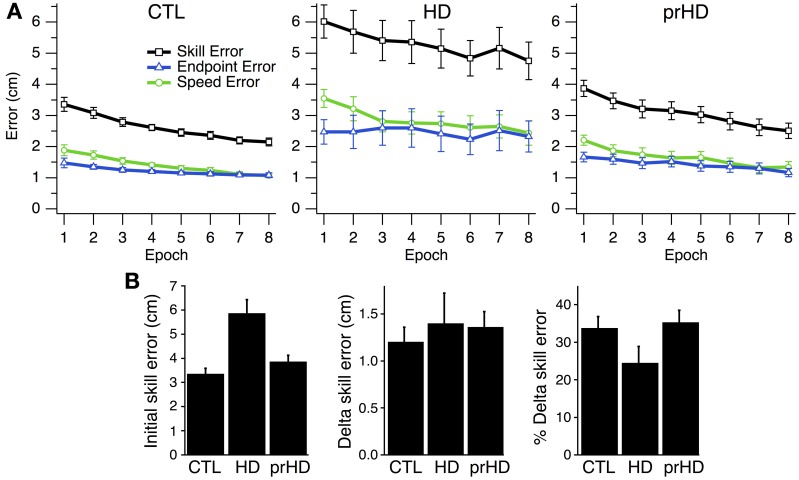
Figure 3.
Time course and group comparisons of skill learning. (A) Group averages (mean ± SE) of skill error (squares, black trace), endpoint error (triangles, blue traces), and speed error (circles, green trace) vs. epoch (32 trials each) for the CTL (left), HD (middle) and prHD (right) groups. (B) Group averages (mean ± SE) of initial skill error, delta skill error and percent delta skill error.

