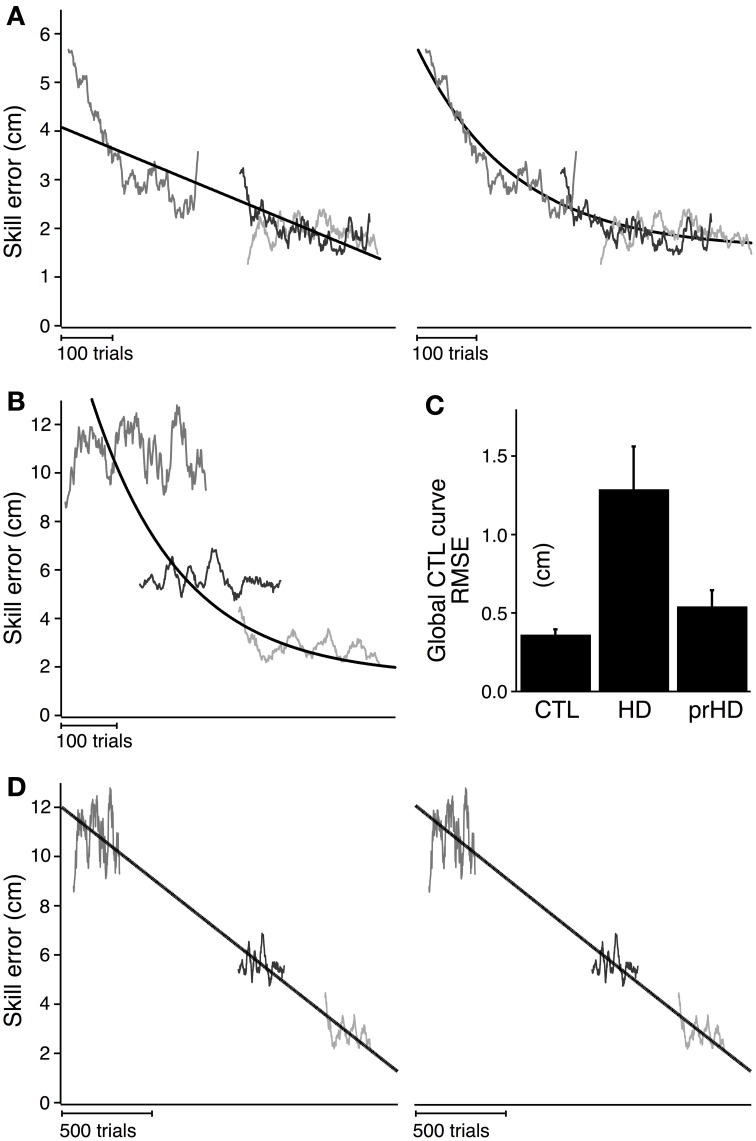
Figure 5.
Modeled time course of speed-accuracy learning. (A) Black lines indicate the time course of skill error for the CTL group as modeled linearly (left; slope = −0.004; intercept = 3.19; AIC = 426) and exponentially (right; time constant = 162.4; amplitude = 2.08; AIC = 117). Smoothed skill errors of three sample CTL subjects (gray) are plotted such that RMSE is minimized. Their position along the x-axis is determined by the global fit process, which treats the learning curves for all subjects in a group as having the same learning rate but allows them to start at subject-specific initial error values. (B) Same exponential fit as (A) (black line), but with the smoothed skill errors of three sample HD subjects (gray). (C) Group averages (mean ± SE) of RMSE calculated with respect to the exponential learning curve for CTL. (D) Black lines indicate the time course of skill error for the HD group as modeled linearly (left; slope = −0.006 cm/trial; intercept = 5.88 cm; AIC = 4051) and exponentially (right; time constant = 62502 trials; amplitude = 364.1 cm; AIC = 4052). Smoothed skill errors of three sample HD subjects (gray) are plotted such that RMSE is minimized.

