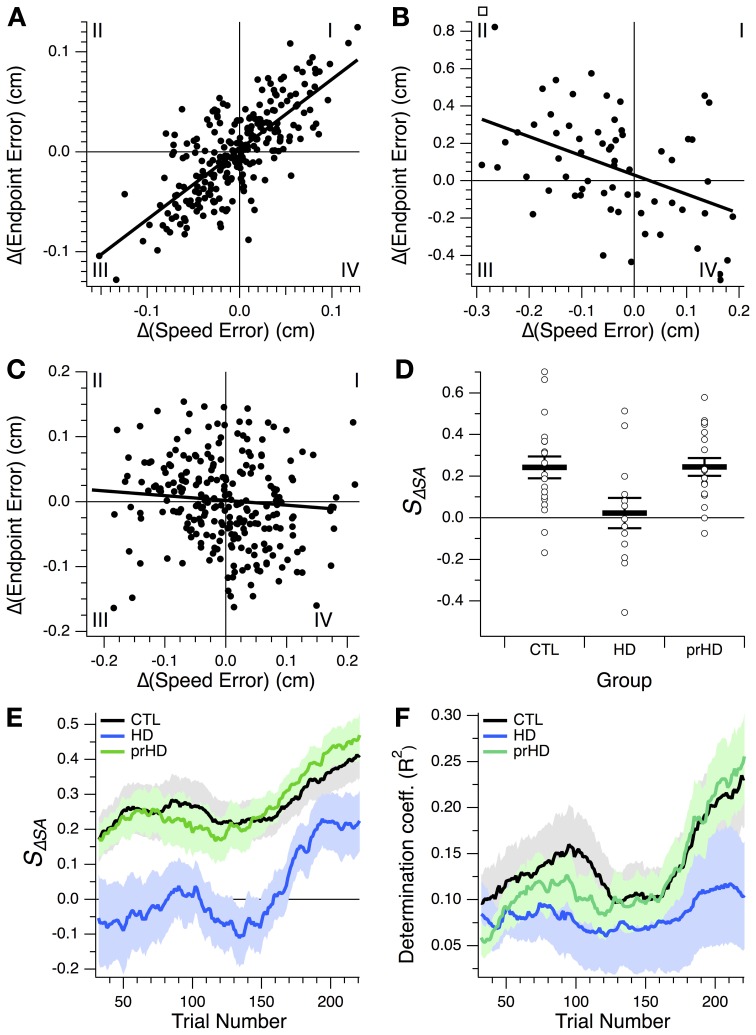
Figure 7.
Relationship between changes in speed and accuracy across trials. (A–C) Trial-by-trial changes in endpoint error vs. changes in speed error for a CTL subject (A) and two HD subjects (B,C). Linear regression lines are also shown. All 256 trials from the learning session are shown in (A,C); the first 64 trials are shown in (B). Roman numerals indicate standard numbering of quadrants in x-y plots. (D) Speed-accuracy-change slope, SΔSA, for the three subject groups studied. This slope is the slope of the linear correlation between endpoint error changes and speed error changes, as illustrated in (A–C). Horizontal bars indicate group mean ± SE. Open circles indicate individual subjects' slopes. (E,F) Progression of speed-accuracy-change slope, SΔSA, and coefficient of determination, R2, for the linear correlation between trial-by-trial endpoint error change, Δ(Endpoint Error), and speed error change, Δ(Speed Error). These correlations were calculated, for each trial, based on a 64-trial window around that trial, which yielded values for trials 32–224 of the 256-trial learning session. Traces indicate group means (black, CTL; blue, HD; green, prHD). Shading denotes standard error.

