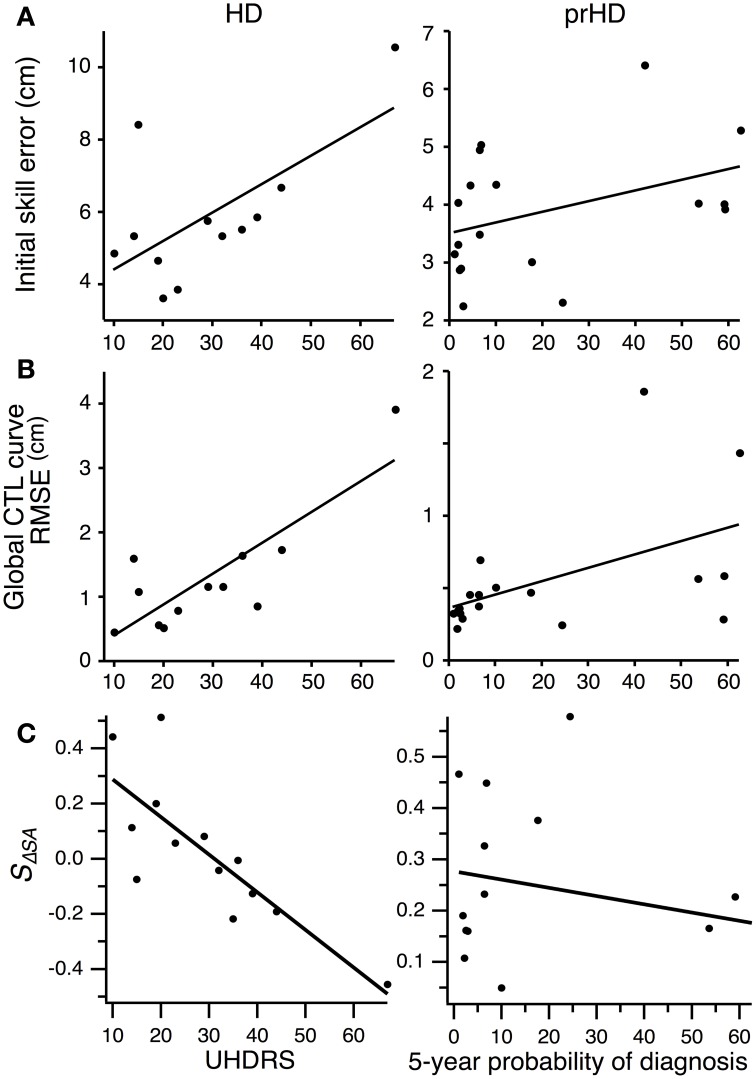
Figure 8.
Correlation between motor performance and disease severity for HD subjects, and between motor performance and proximity to symptom onset for prHD subjects. Each point represents individual subject averages. Lines indicate linear regressions. (A) Relationship between initial skill error and UHDRS for HD subjects (left), and between initial skill error and 5-year probability of diagnosis for prHD subjects (right). (B) Relationship between the RMSE calculated with respect to the global exponential CTL curve and UHDRS for HD subjects (left), and between RMSE and 5-year probability of diagnosis for prHD subjects (right). (C) Relationship between speed-accuracy-change slope (SΔSA) and UHDRS score for HD subjects (left), and between this slope and 5-year probability of diagnosis for prHD subjects (right).

