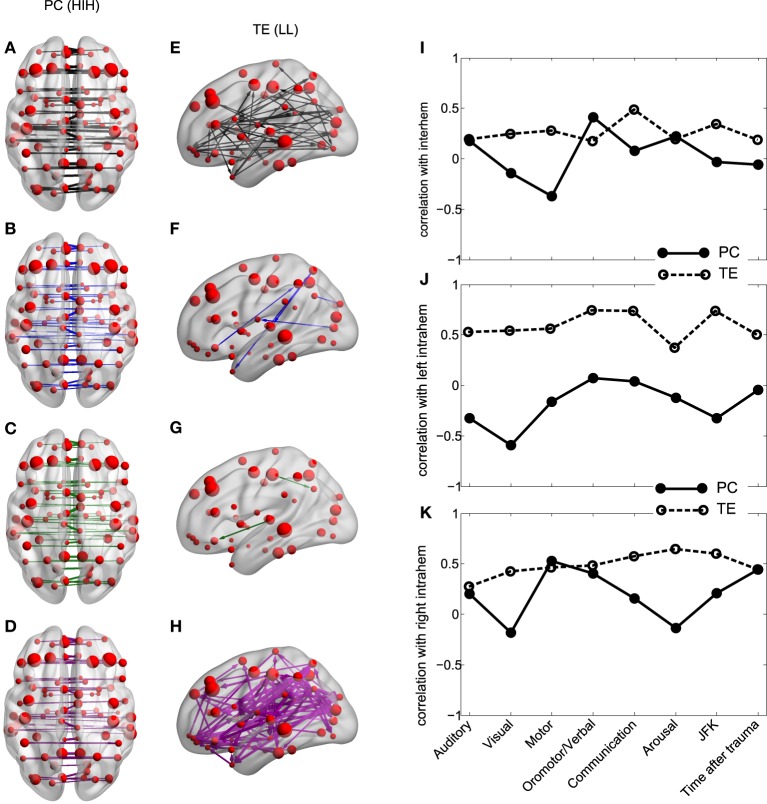
Figure 4.
Inter-hemispheric PC and left intra-hemispheric TE. (A–H) PC and TE values for all the 4 different groups. The thickness of links and arrows are proportional to the PC and TE values; the thickness normalization factor is common among all the 4 groups. (A,E) group G1, black, (B,F) group G2, blue, (C,G) group G2a, green, (D,H) group G2b, magenta. (A–D) Visualization of the PC values HIH (homologue inter-hemispheric pairs). (E–H) TE in LL (left intra-hemispheric pairs). For clarity in the visualization, links have been thresholded and only TE values bigger than TE = 0.2 are depicted. (I–K) Correlation between PC (solid line) and TE (dashed) with the CRS-R scores at the different functional scales: Auditory, Visual,Motor, Oromotor/Verbal, Communication, Arousal and the total sum over all the function scales (JFK) as well as with the acquisition time after trauma. The correlation has been calculated over pairs which are (I) inter-hemispheric (HIH for PC and (HLR+HRL)/2 for TE, (J) left intra-hemispheric (LL) and (K) right intra-hemispheric (RR).

