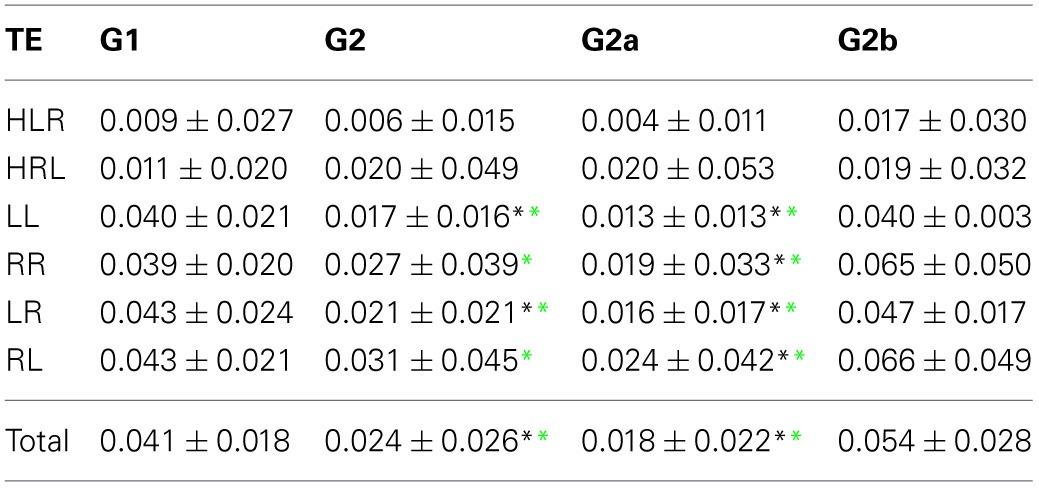
Table 3.
TE average values ± standard deviation.

*Significantly different from G1; p < 0.05. Significant differences are indicated with black asterisks for ANOVA and green for Kruskal-Wallis tests. HLR: homologous inter-hemispheric from left to right; HRL, homologous inter-hemispheric from right to left;
LL, left intra-hemispheric; RR, right intra-hemispheric; LR, inter-hemispheric left to right; RL, inter-hemispheric right to left.
