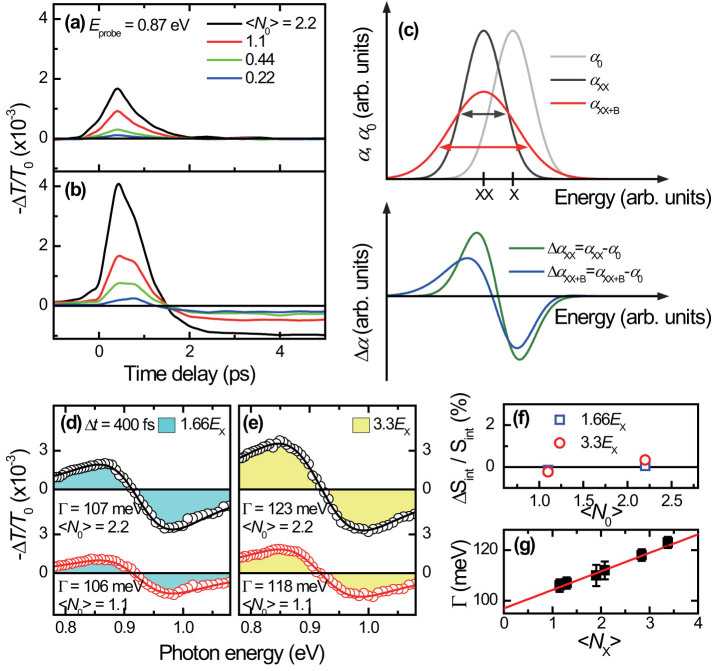
Figure 3. Ultrafast MEG-induced biexciton transients before the intra-band relaxation.
Transient Exx dynamics are shown as a function of Δt for the 1.66Ex pump (a) and for the 3.3Ex pump (b) with various 〈N0〉. (c) Schematic illustration of the PA caused by the transient Stark shift of the single-exciton absorption (black line) and the corresponding photo-induced biexciton broadening (red line). The gray line indicates the single-exciton absorption without the pump. The differential PA spectra exhibit an energy-shifted broader feature (blue line) due to the MEG-induced exciton scattering compared to the case of no MEG (green line). The spectrally-resolved PA spectra with the probe range from 0.78 to 1.08 eV measured at Δt = 400 fs are shown for the 1.66Ex pump (d) and for the 3.3Ex pump (e) with two different 〈N0〉. Solid lines represent numerical fits using equation (1). The obtained biexciton Γ for the 1.66Ex pump with 〈N0〉 = 1.1 and 2.2 are 106 meV and 107 meV, respectively, and those for the 3.3Ex pump with 〈N0〉 = 1.1 and 2.2 are 118 meV and 123 meV, respectively. (f) Spectrally integrated areas of the broadened biexciton absorption. (g) The biexciton Γ broadening linearly increases with increasing the total number of excitons. The experimentally determined Γ (black filled squares) from the Figs. 3d and e are compared to the equation (2).

