Figure 5.
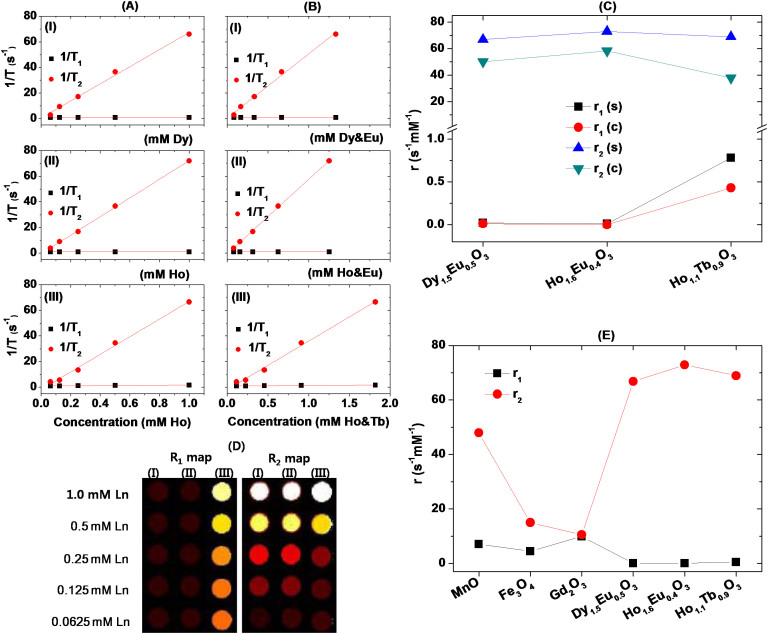
Plots of 1/T1 and 1/T2 as a function of (A) Dy (or Ho) and (B) combined Dy&Eu (or Ho&Eu or Ho&Tb) concentrations for aqueous sample solutions of D-glucuronic acid coated ultrasmall (I) Dy1.5Eu0.5O3, (II) Ho1.6Eu0.4O3, and (III) Ho1.1Tb0.9O3 nanoparticles. (C) Plot of r1 and r2 values of three sample solutions estimated from single (“s”) and combined (“c”) concentration plots in (A) and (B), respectively. (D) R1 and R2 map images of three aqueous sample solutions (Ln = Dy in (I), and Ho in both (II) and (III)). (E) Plot of r1 and r2 values of various nanoparticles estimated at 1.5 tesla and 22°C: D-glucuronic coated Gd2O3 nanoparticle (davg = 1.0 nm)57, PEG-diacid coated Fe3O4 nanoparticle (davg = 1.7 nm)58, D-glucuronic acid coated MnO nanoparticle (davg = 2.5 nm)59, and three kinds of D-glucuronic acid coated ultrasmall mixed lanthanide oxide nanoparticles studied here.

