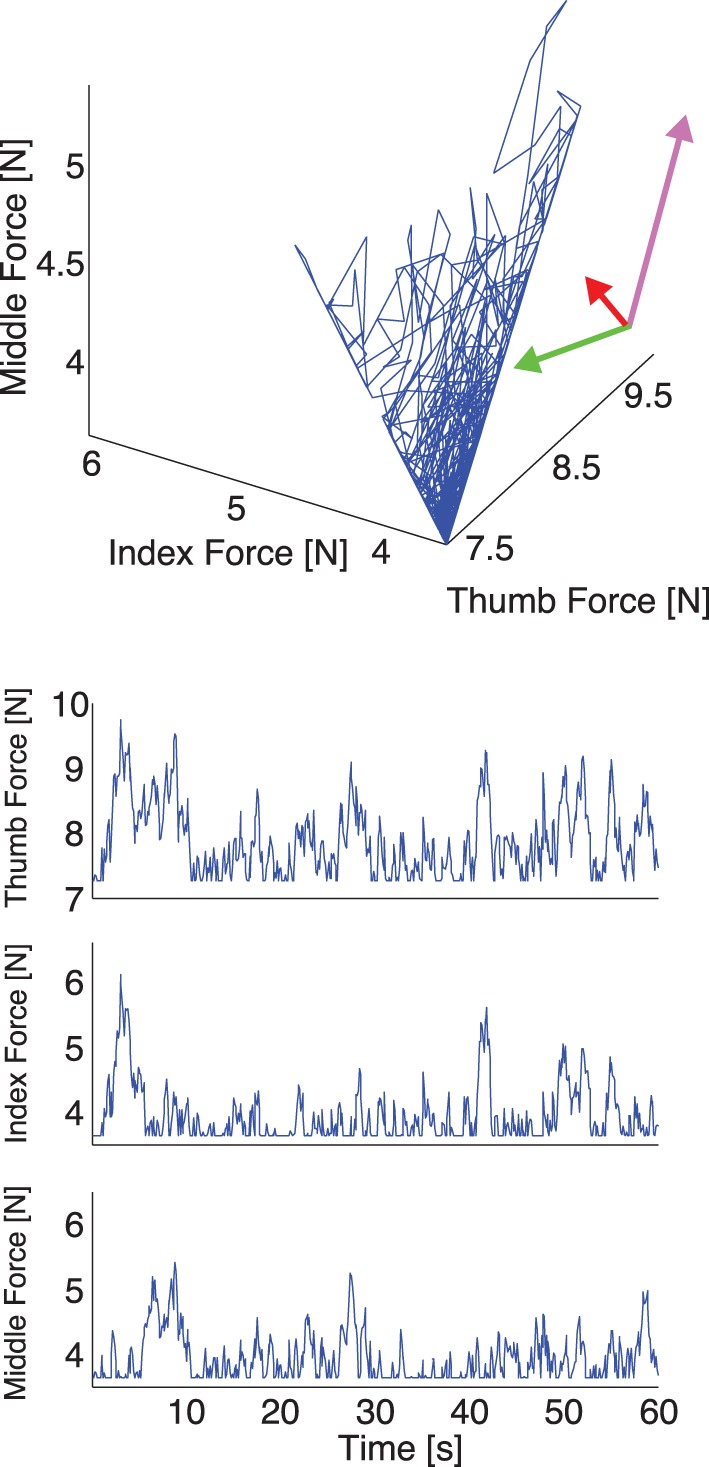
Figure 3.

Representative plot of the simulated thumb, index, and middle finger normal forces without visual feedback. Top: The three simulated normal forces plotted against each other. Note that the force fluctuations come to lie on a plane, whose orientation we compute using PCA. The rotated coordinate system indicates the directions of normal force variability, and the lengths of the arrows indicate the variance explained along that direction. Note that since in the simulation the motor task is executed perfectly, two directions, which span a manifold of solutions, explain all variability. Bottom: The three simulated normal forces during a trial plotted individually. Note that the floor effect results from the hard constraint of minimum normal force in the simulation, which for the subjects is more flexible and can result in a downward trend in total grasp force in trials without visual feedback.
