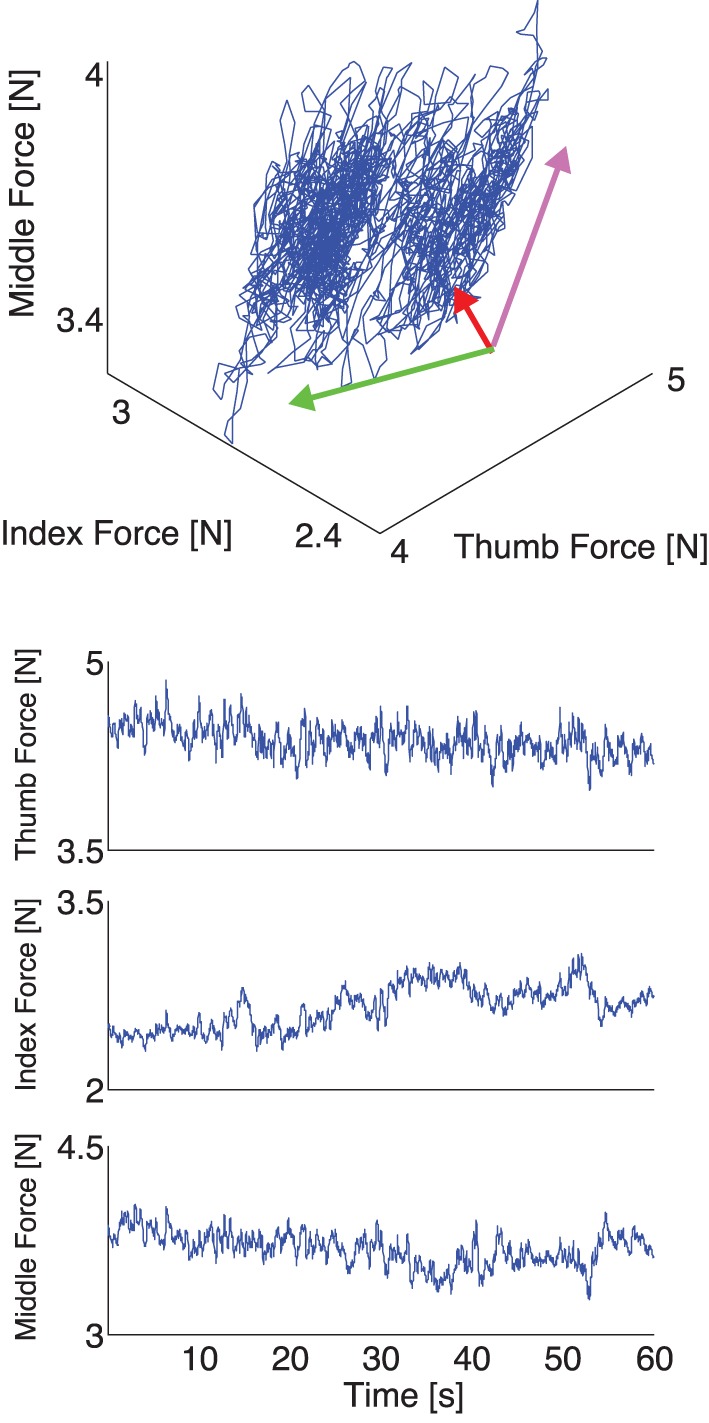
Figure 5.

Representative plot of experimental thumb, index, and middle finger normal forces recorded during one trial with a 200 g weight, with visual feedback. Top: The three normal forces plotted against each other. Note that the force fluctuations come to lie on a plane, as is expected if the task constraints are met (see Appendix and Figure 2, note the rotated and scaled coordinate system), but the variability in normal forces populates the plane in a tighter cluster given that a constant total grasp force is now a task constraint the subjects enforces. Bottom: The three normal forces during a trial plotted individually. Note the absence of a downward trend across the three fingers, due to the enforcement of the visual constraint on the sum of normal forces.
