
Figure 7.
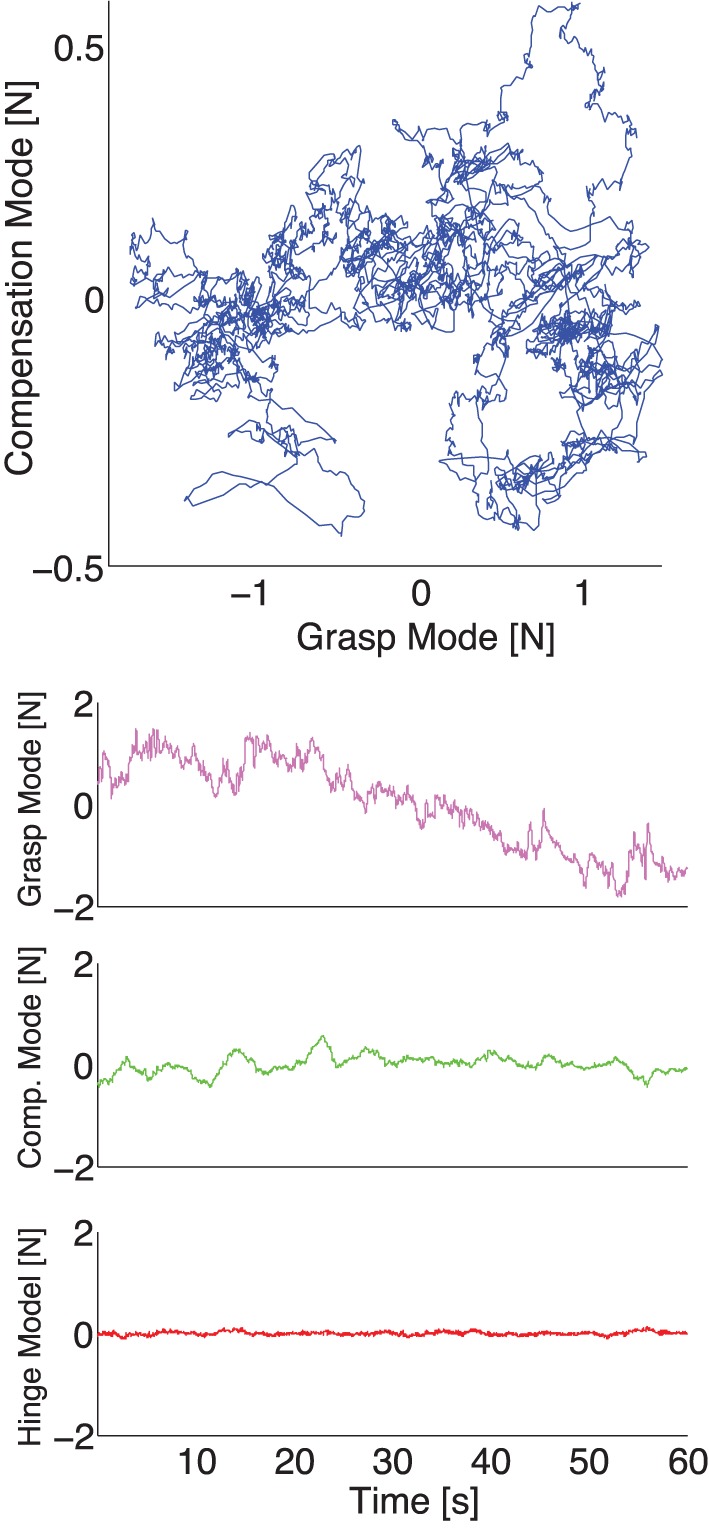
Representative plot of the experimental normal forces now projected onto the principal components for the same representative trial as in Figure 4without visual feedback. Top: The force fluctuations on the plane spanned by the Grasp and Compensation Modes. Bottom: The three principal component time series during a trial plotted individually. Note how the Grasp Mode captures the common downward trend, while the Compensation and Hinge Modes have relatively lower variability.