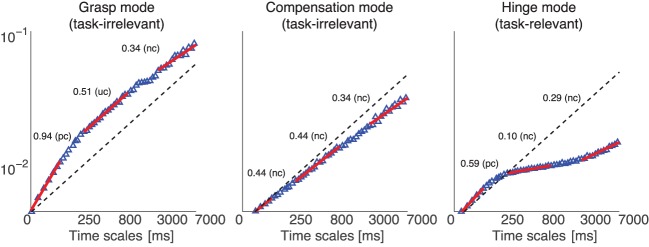
Figure 8.

Representative DFA of projected normal force time series from one subject, where the data were collected in a 200 g weight trial, without visual feedback. The plot shows the three scaling regions (1–50, 250–500, and 3500–7000 ms) which we used to fit the scaling exponent, for each normal force correlation Mode (Grasp, Compensation, and Hinge Modes). The red lines show the linear fits to the behavior of diffusion vs. time scale—their slopes can either be greater than, equal or less than 0.5 (dashed line), indicating the diffusive process is positively correlated (pc or uncorrected divergence), uncorrelated (uc or Brownian motion), or negatively correlated (nc or corrective action), respectively, at those time scales.
