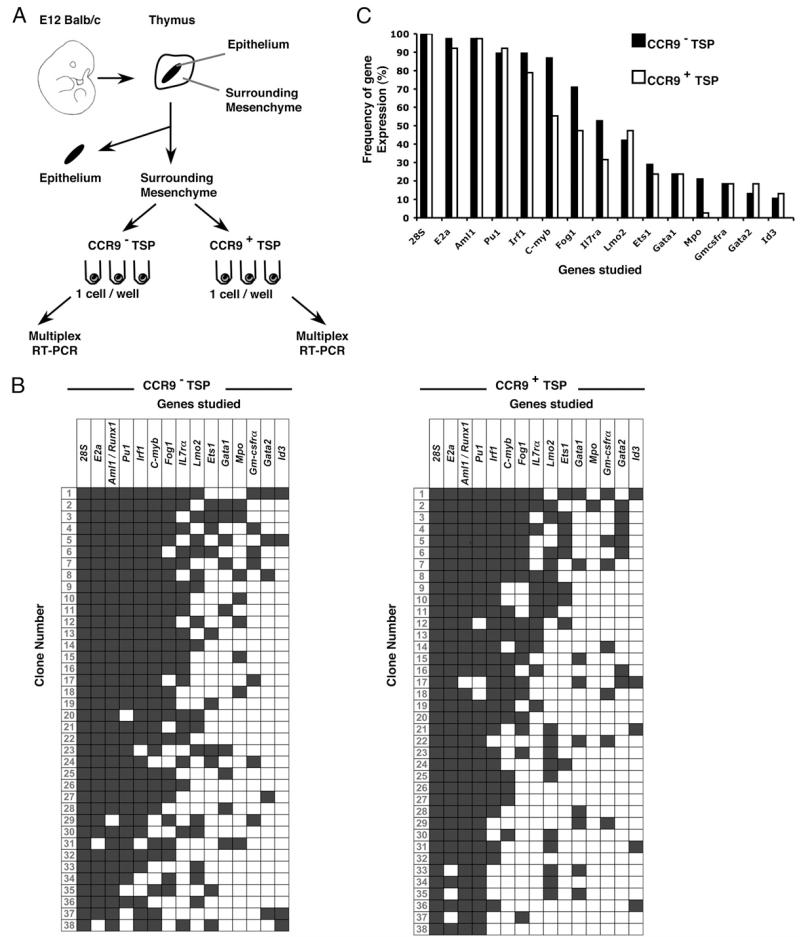
FIGURE 5. Clonal multiplex coexpression analysis reveals genetic similarities between, and within, CCR9+ and CCR9− TSP.
The schema in A summarizes isolation of CD45+CCR9− and CD45+CCR9+ TSP from perithymic mesenchyme surrounding the E12 thymus, which were studied individually by multiplex RT-PCR for the expression of 15 genes. B shows a summary of gene expression of each clone, as determined by multiplex RT-PCR. ■, Positive gene expression; □, an absence of expression. Cells were scored as positive by the expression of 28S rRNA. C shows a summary of the frequency of gene expression in CD45+CCR9− (■) and CD45+CCR9+ (□) cells.

