
Figure 1.
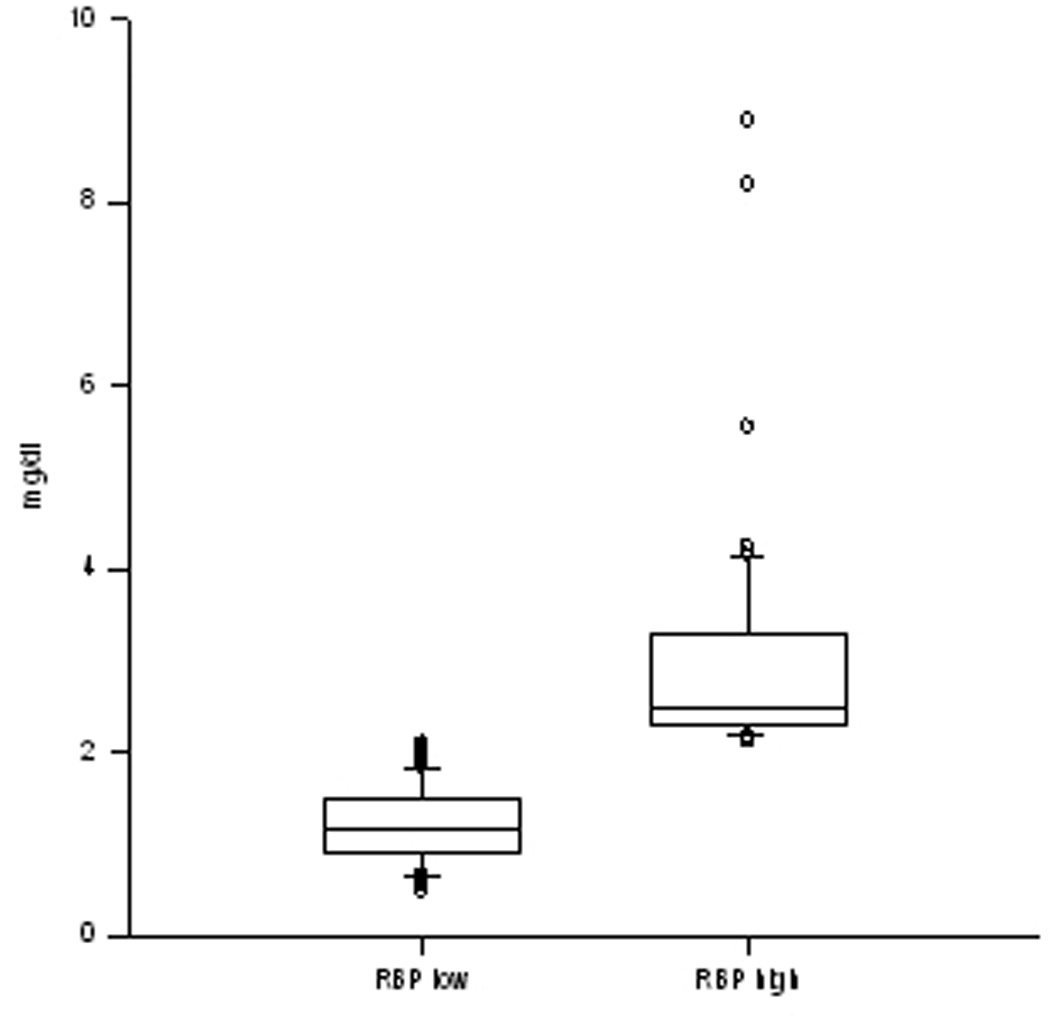
Box plot of the retinol binding protein (RBP) values of both groups. Both groups showed consistency in their RBP levels. The RBP high group skewed toward the upper quartile with a maximum of 4 mg/dL, whereas in the RBP low group, the values are nearly equally distributed among the patients.