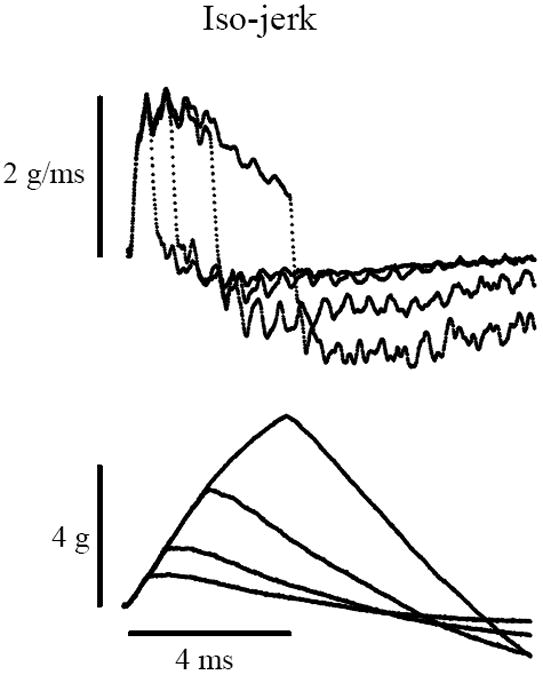
Figure 1.

Iso-jerk stimulus protocol. Recordings of stimulus jerk (Top, in g/ms) and acceleration (Bottom, in g). Top: The duration (rise time) of the jerk stimulus (g/ms) is varied (0.5, 1, 2 & 4ms) while the peak amplitude is held constant. Bottom: Peak acceleration (g) increases systematically (~0.9, 1.7, 3.3 and 5.5g) with increasing jerk duration. Calibration bars indicate scales for acceleration, jerk and time.
