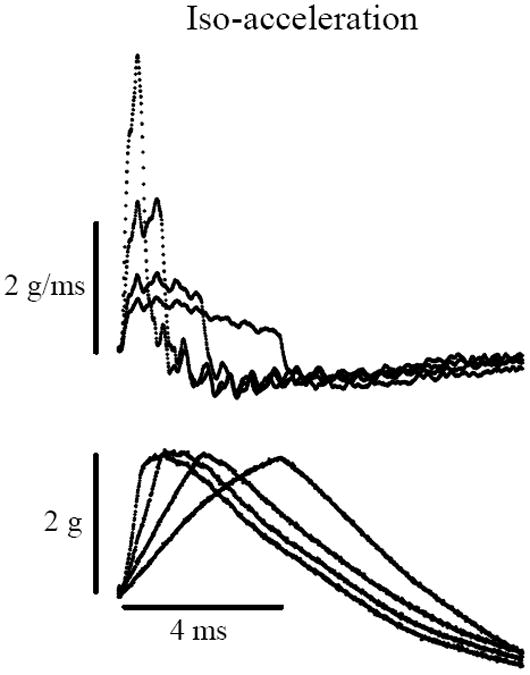
Figure 2.

Iso-acceleration stimulus protocol. Recordings of stimulus jerk (Top, in g/ms) and acceleration (Bottom, in g). Top: Stimulus jerk levels systematically increase (~0.9 1.25, 2.3 & 4.6 g/ms) as the rise time to a constant peak acceleration (2g) decreases. Bottom: Peak acceleration level is held constant (2g) while the time lapsed during the rise to peak level (rise time) is varied (0.5, 1, 2 & 4ms). Achieving a constant peak acceleration level requires systematically higher jerk levels as shown in the Top tracings. Calibration bars indicate scales for acceleration, jerk and time.
