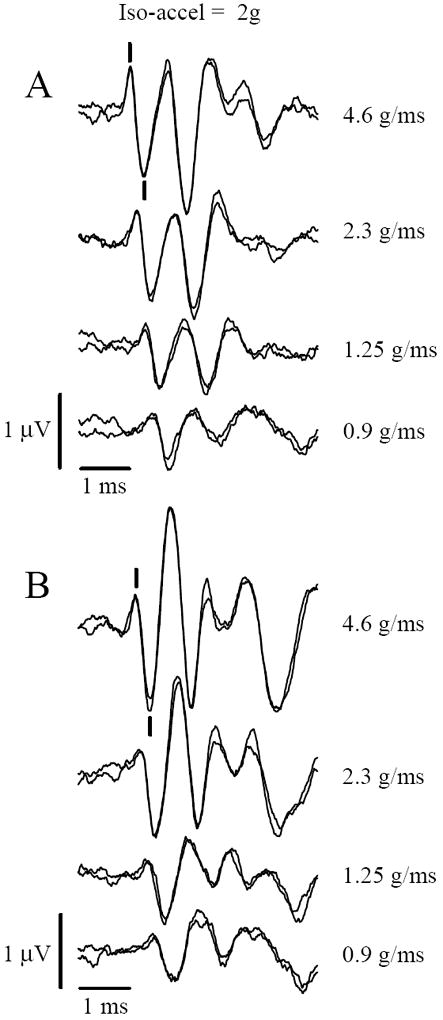
Figure 3.

VsEP responses recorded during iso-acceleration (2g) protocol. Responses increase in amplitude and decrease in latency during increasing jerk levels despite constant peak acceleration level (2g). Jerk levels are indicated to the right (g/ms). Top (A) is a C57 mouse. Bottom (B) is a Nox3het (+/-) mouse. Calibration bars indicate scales for amplitude and latencies. Latencies represent time elapsed after the onset of the stimulus. The scoring of P1 and N1 is indicated with marks for the top most group (5g), positive up.
