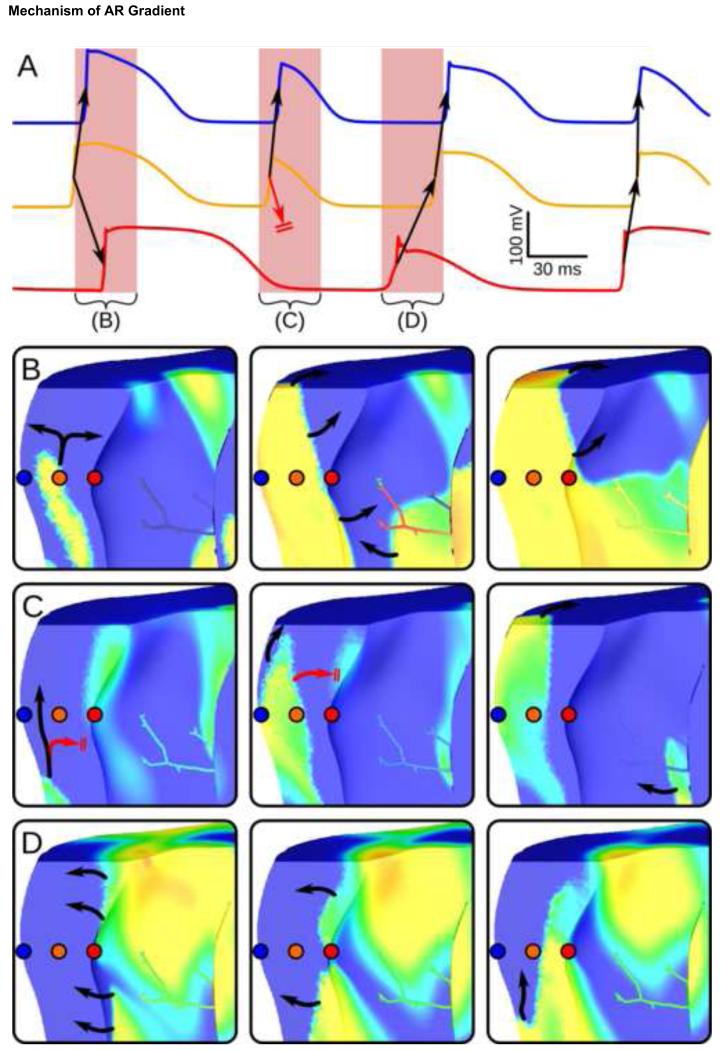
Figure 5.
(A): Vm recordings from 3 points, shown spatially in (B), for model with high-IK(ATP) epicardium, low-IK(ATP) endocardium, and sub-endocardial PS endpoints. Arrows indicate wavefront propagation, with conduction block indicated by double lines. Vm snapshots for highlighted intervals are shown in B-D (10ms between snapshots; same Vm scale as Fig. 4). (B): Excitation propagates from the midmyocardium towards both surfaces. (C): Conduction to low-IK(ATP) endocardium blocks due to intrinsically longer APs. (D): Activation proceeds from recovered endocardium to epicardium.

