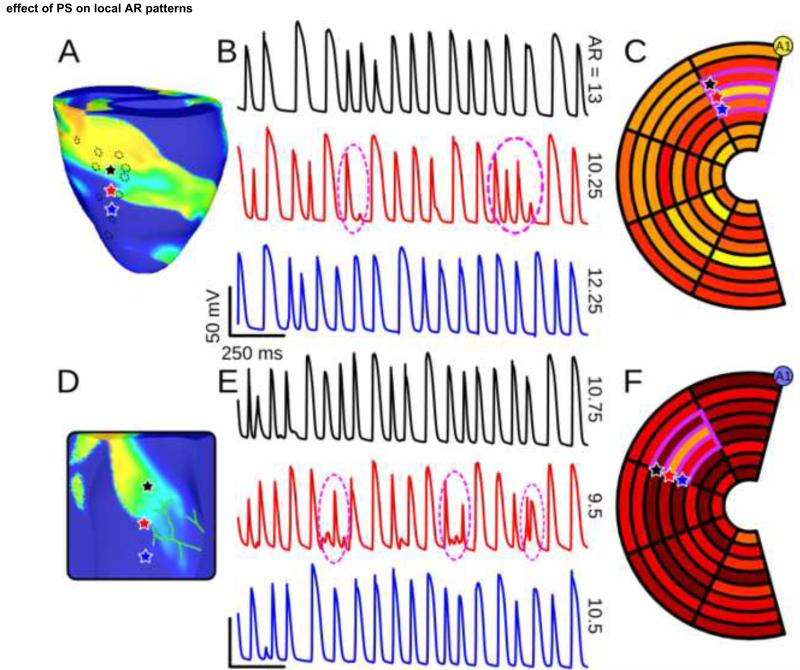
Figure 6.
(A): Vm snapshot with 3 highlighted epicardial recording sites; from the model with medium-IK(ATP) epicardium, low-IK(ATP) endocardium, and sub-epicardial PS. Dashed circles show approximate locations of PS endpoints. (B): Vm recordings from the 3 sites indicated in (A), matched by color. Intervals where AR was reduced due to PS activity are highlighted (dashed circles). (C): Epicardial AR plot (same scale as Fig. 4) for the model from (A) showing spatial disorganization (Moran’s I=−0.00831). (D-F): Same as (A-C) but for the model with high-IK(ATP) endocardium, low-IK(ATP) epicardium, and sub-endocardial PS (visible in (D)). For endocardial AR plot in (F), Moran’s I=−0.0798). Electrode A1 is indicated for bull’s eye plot orientation (see Fig. 2C). Supplementary Movies 3&4 show full Vm sequences for both examples.

