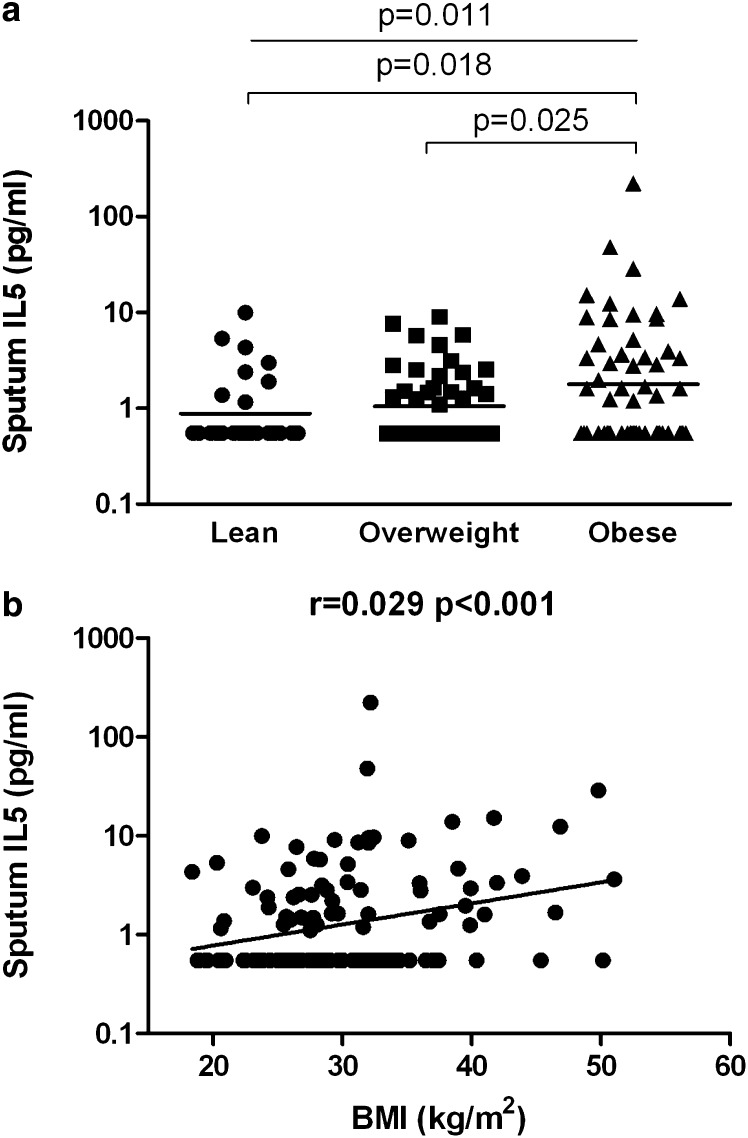
Figure 1.
The relationship of sputum IL-5 and obesity in severe asthma. (a) Subjects are classified by their body mass index (BMI) (kg/m2) into lean (<24.9); overweight (≥25–29.9); and obese (≥30). The bar represents the geometric mean sputum IL-5 concentration (pg/ml). P value across the groups (ANOVA) is given above the solid line. For pairwise comparisons, P values are given above the line with markings at each end (unpaired t tests for exact P values, when Tukey’s post hoc test P < 0.05). (b) Correlation between sputum IL-5 and BMI.

