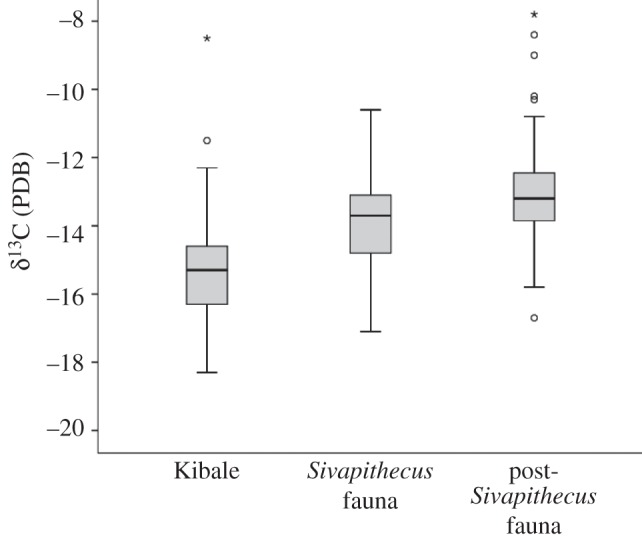
Figure 2.

Distribution of carbon values for Kibale, Sivapithecus faunas, and post-Sivapithecus faunas. The Sivapithecus fauna overlap with Kibale fauna but overall exhibit higher carbon values, indicative of more woodland habitat. The post-Sivapithecus fauna indicate a shift to even more open habitat and less overlap with Kibale. For each faunal set, the middle line represents the median. The bottom of the box is the 25th percentile, while the top of the box is the 75th percentile. T-bars extend to 1.5 times the height of the box or to the minimum and maximum values. Points are outliers, with asterisks being extreme outliers more than three times the height of the box. For Kibale, warthogs are included in the analysis but not shown on graph, given their extreme value of −2.4‰.
