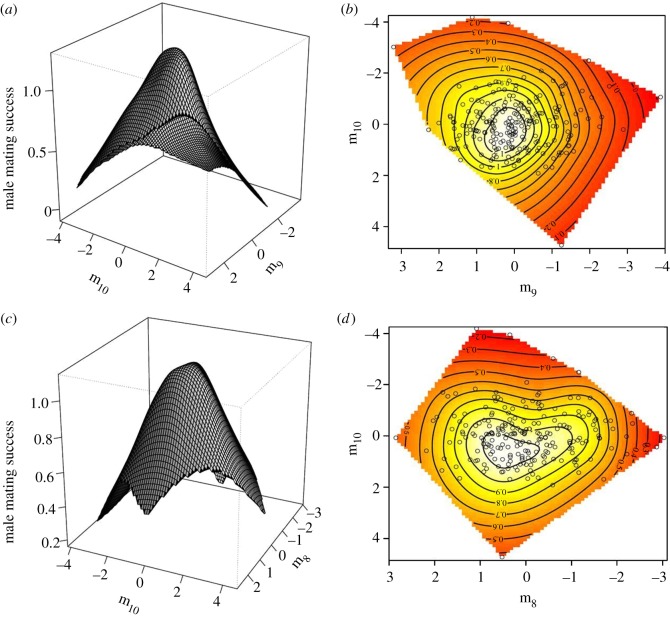
Figure 1.
Thin-plate spline visualizations of the major axis of stabilizing selection (m10) and each of two other axes of stabilizing selection (m8 and m9) operating on CHCs of males captured in the wild. m9 versus m10: (a) perspective-view and (b) contour map. m8 versus m10: (c) perspective-view and (d) contour map. Each point on the contour plots represents an individual male.

