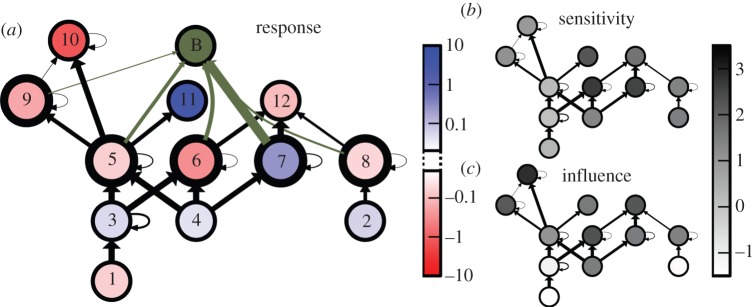
Figure 1.

Predicted response of the Gatun Lake food web [10] to the perturbation caused by the introduction of the peacock bass. Shown are species (circles) and predator–prey relationships (arrows, in the direction of the biomass flow). In (a), the peacock bass population (B) is shown, together with its feeding relations. The colour code denotes the response of each species to this perturbation for a specific set of generalized parameter values (see the electronic supplementary material for details). In (b) and (c), the grey scale denotes the sensitivity and the influence of each species, respectively, approximating its average propensity to be impacted by other species or to impact to other species (details are given in §4 and the electronic supplementary material). (Online version in colour.)
