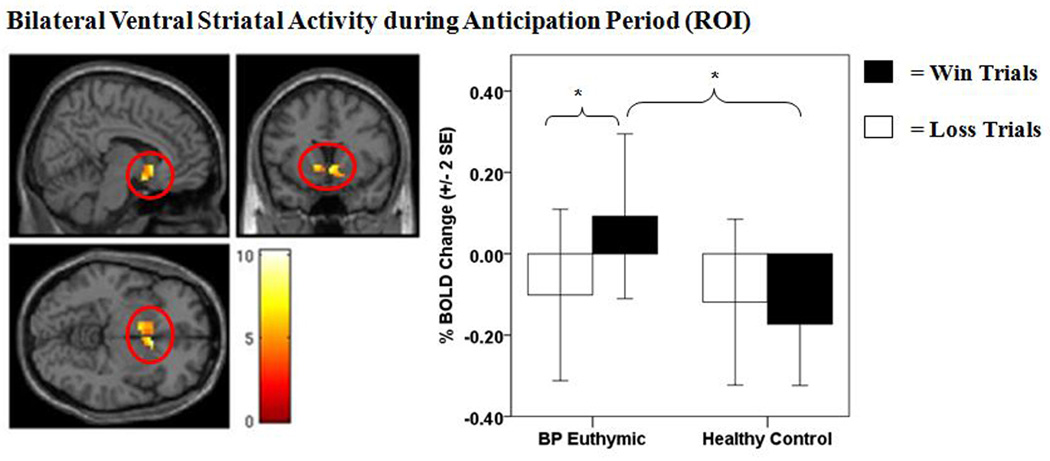
Figure 2.
Bilateral ventral striatal activity during anticipation period [region of interest (ROI)]. The left panel displays the anatomical location of the significant group × anticipation condition interaction on the bilateral ventral striatal ROI mask, defined as 8 mm spheres based on the Montreal Neurologic Institute coordinates system (right: x = 9, y = 9, z = −8; left: x = −9, y = 9, z = −8) from previous meta-analytic research [Di Martino et al. 2008 (30); Postuma and Dagher 2006 (31)]. [Right: F(1,39) = 10.91, p < 0.001, k = 42 voxels, p < 0.05, family wise error (FEW) corrected; Left: F(1,39) = 8.34, p < 0.005, k = 28 voxels, p < 0.05, FEW corrected]. The right panel displays a histogram of the mean bilateral ventral striatal activity depicting the group × anticipation condition interaction. Color bars reflect beta values and significant clusters were overlaid on sagittal, coronal, and axial brain slices. Statistical tests were performed within SPM and beta values were extracted for graphical purposes only. BOLD = blood-oxygen-level-dependent; SE = standard error; BP euthymic = bipolar disorder patients in a euthymic state (n = 21); healthy controls (n = 20). *significant post-hoc comparison at p < 0.013 (Bonferroni corrected).

