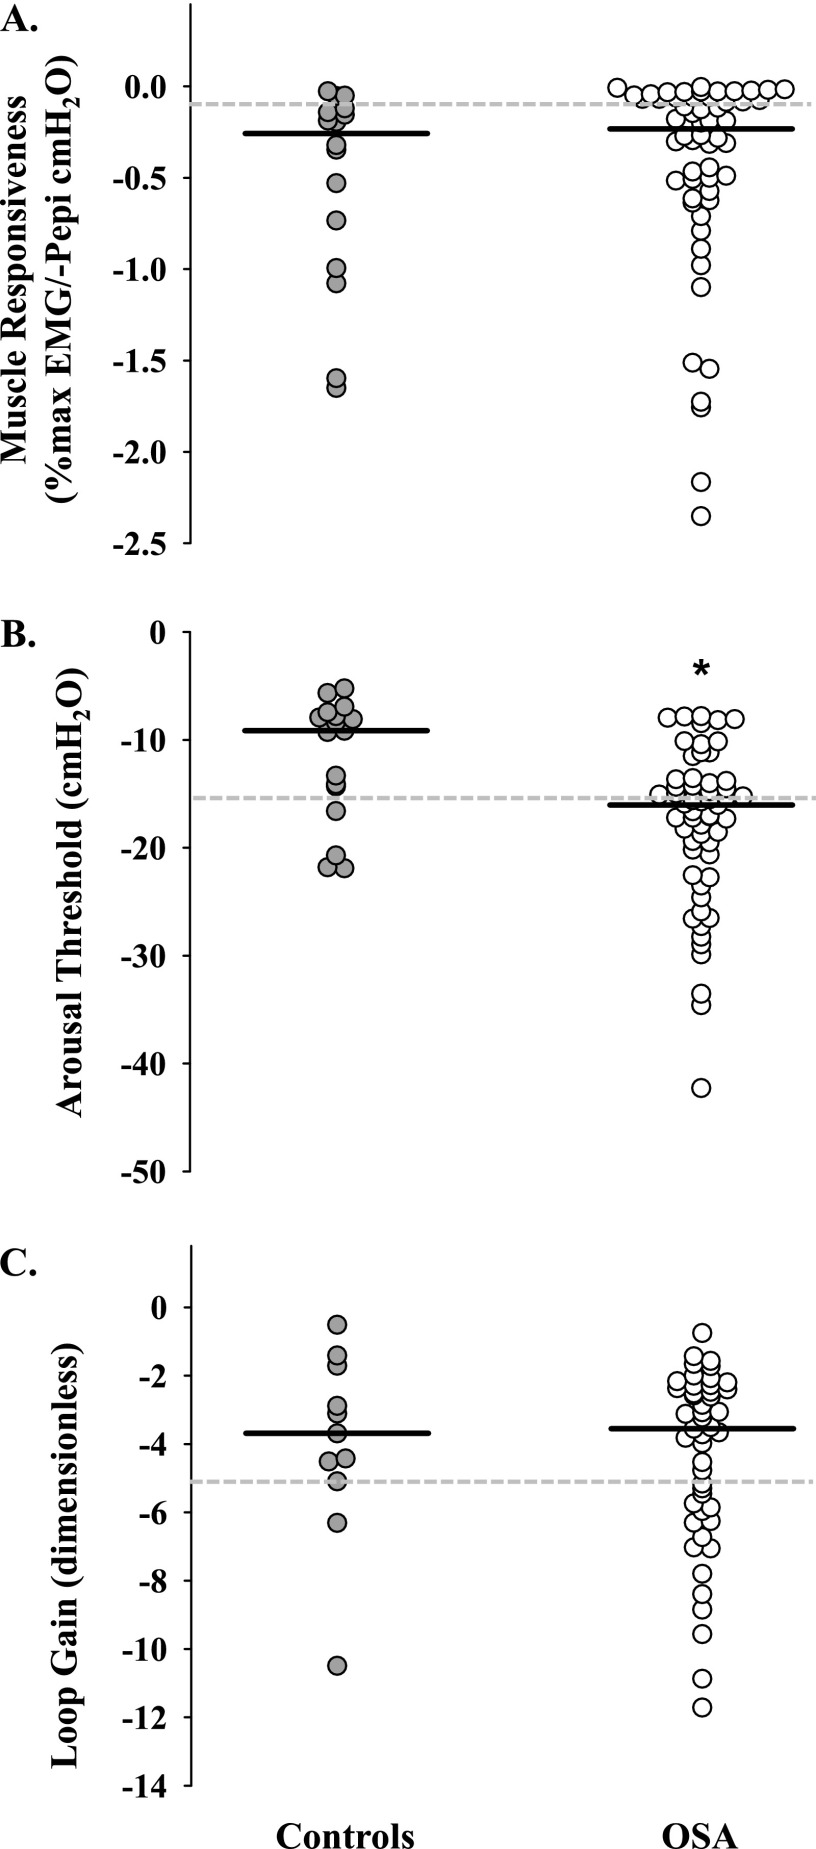
Figure 3.
Phenotypic trait scatter plots for (A) slope of genioglossus muscle responsiveness versus negative epiglottic pressure, (B) the respiratory arousal threshold, and (C) loop gain. Note the large degree of between-subject variability within patients with OSA and control subjects and considerable between-group overlap for each of the pathophysiologic parameters. Horizontal black lines represent median values. Values above the dashed grey lines in A (more positive) and B (more positive) indicate poor muscle responsiveness and a low arousal threshold, respectively. Values below the dashed grey line in C (more negative) indicate a high loop gain. Refer to text and Tables 2 and 3 for further detail. *Significant difference between groups (P < 0.05). OSA = obstructive sleep apnea; Pepi = epiglottic pressure.

