Figure 1.

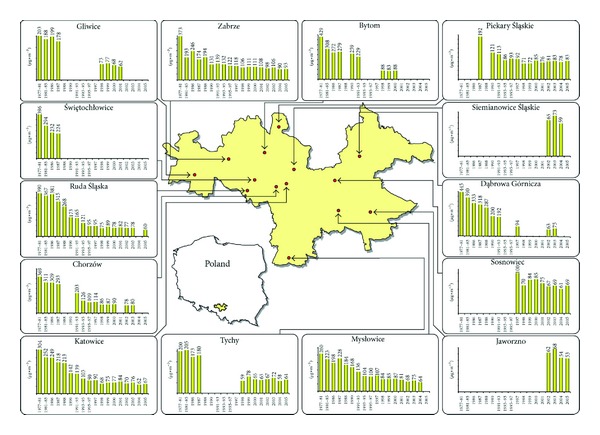
Total PM concentrations (μg/m3) in 14 cities of the Upper Silesian urban area in the years 1977–2005 (figure taken from study [31]).

Total PM concentrations (μg/m3) in 14 cities of the Upper Silesian urban area in the years 1977–2005 (figure taken from study [31]).