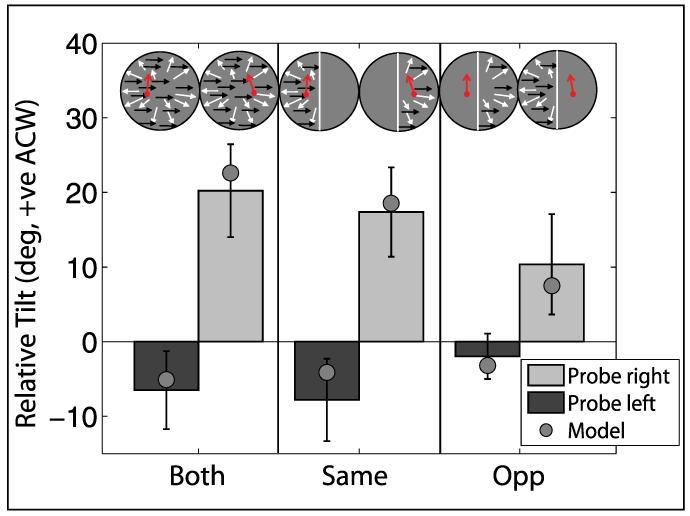
Figure 8. Data from Experiment 1.
Light bars show data from conditions in which the probe was in the right hemi-field. Dark bars show data from conditions in which the probe was in the left hemi-field. Circles correspond to the best fit linear weighting model described after Experiment 2. Relative tilt is measured as positive in the anticlockwise (ACW) direction. Error bars represent 95% confidence intervals. A schematic illustration of the conditions together with a graphical representation of the effects (orientation of red arrow relative to vertical) is also provided at the top of the plot.

