Figure 2.

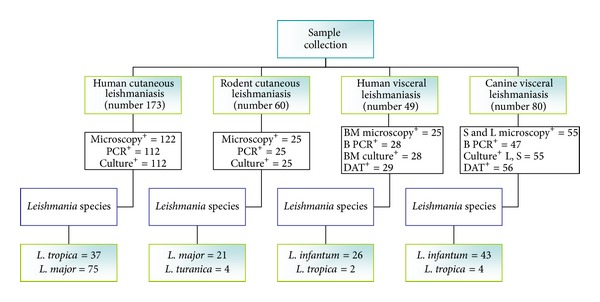
Flow chart which outlines the major parts of the study and results. B PCR: blood PCR, BM: bone marrow, S: spleen tissue, L: liver tissue, and DAT: direct agglutination test.

Flow chart which outlines the major parts of the study and results. B PCR: blood PCR, BM: bone marrow, S: spleen tissue, L: liver tissue, and DAT: direct agglutination test.