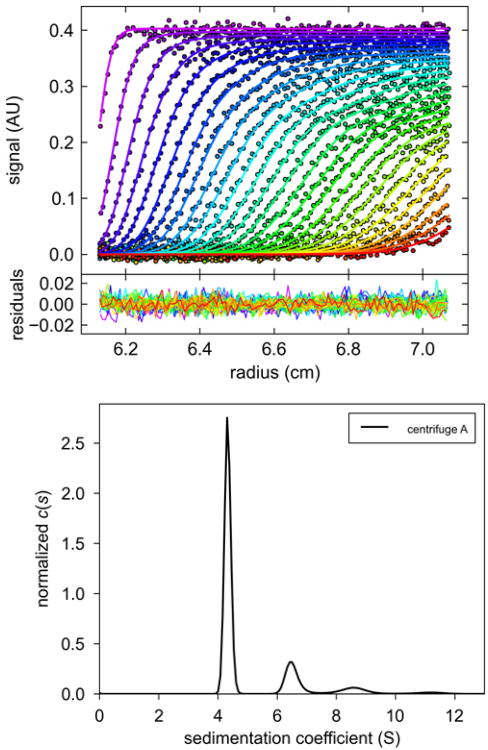
Figure 2.
(A) Representative absorbance scans of the sedimentation velocity data of BSA (symbols, showing only every 3rd data point of every 3rd scan), and best-fit boundary model from the c(s) analysis in SEDFIT (solid lines). (B) Residuals of the fit, with a root-mean-square deviation of 0.0054 OD. (C) Best-fit sedimentation coefficient distribution c(s). Figure created with GUSSI, reproduced from [40].

