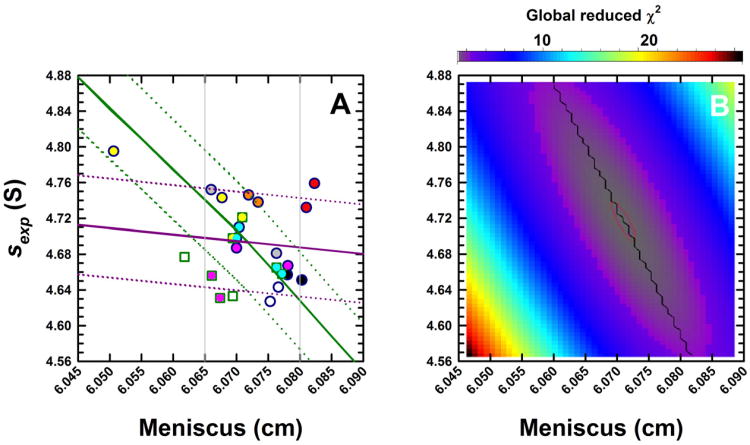
Figure 3.
(A) Experimental sedimentation coefficients for monomeric BSA obtained from eight analytical ultracentrifuges in study I, plotted as a function of the best-fit meniscus position. Experiments were conducted in duplicate and data obtained from Cell 1 for the different centrifuges are shown in unique colors. Absorbance (round symbols) and, when possible, interference (square symbols) data were collected. As Version 6.0 (Firmware 5.06) of the ProteomeLab XL/I acquisition software was used in all ultracentrifuges, sedimentation coefficients are ∼ 10% larger than the true value. Using the average best-fit s-value of the BSA monomer and meniscus position, a set of sedimentation velocity data were simulated in SEDFIT. The solid green line shows how a fixed meniscus position influences the best-fit s-value in a c(s) analysis. Simulated SV data were radially translated to simulate translation errors δr in the radius. The solid purple line shows how such errors influence the sedimentation coefficient. Dotted green and purple lines show s-values if the temperature were changed by ± 0.5 °C. (B) Simulated data were analyzed in SEDPHAT in terms of a single non-interacting ideal solute. The error surface depicting the global reduced χ2 as a function of the s-value and fitted meniscus position shows a well defined minimum.

