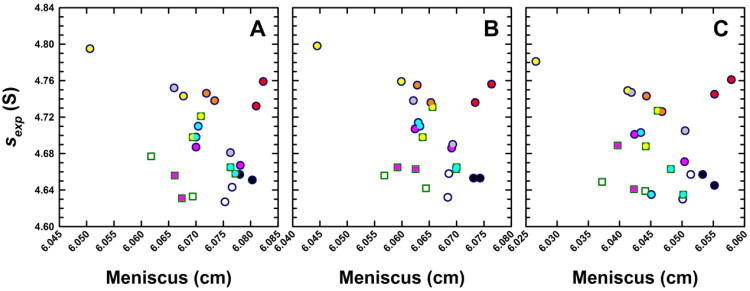
Figure 4.
Experimental sedimentation coefficients for monomeric BSA obtained from eight analytical ultracentrifuges in study I plotted as a function of the best-fit meniscus position. Panels show data obtained from (A) Cell 1, (B) Cell 2 and (C) Cell 3 of identical runs illustrating consistencies in data collected from the same ultracentrifuge. The same instrument color coding is used for each cell and the complete data set is listed in Supplementary Table 1.

