Figure 5.
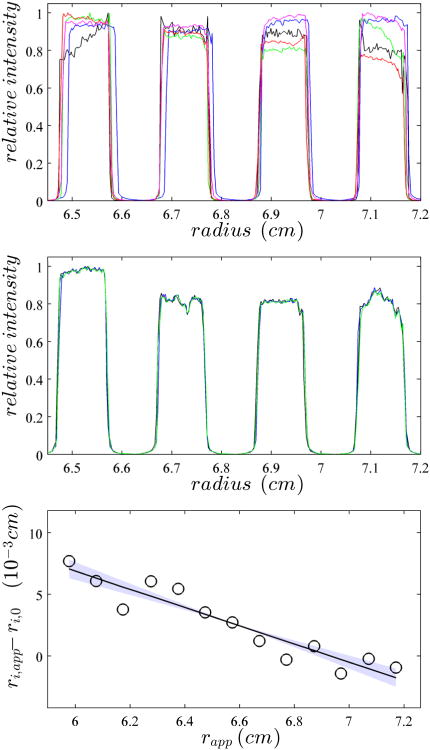
Calibration of the radial magnification through imaging of the mask. (Top) Overlay of the absorbance intensity scans of the mask obtained from five different centrifuges at 50,000 rpm. The same cell assembly with mask was run in all instruments, without disassembly. For clarity, only a subset of the image is displayed that shows only 4 of the 7 calibration holes. (Middle) Analogous overlay of mask images from repeat experiments from the same instrument. (Bottom) To determine the edges of the calibration holes, 10 replicate scans of the mask are analyzed and the apparent radial position of the average steepest ascent, ri,app , are determined. The spacing between the ri,app is compared to the expected spacing of 1.0011 mm, and plotted as the difference of all ri,app positions to the best-fit edge positions constraining their distance to be 1.0011 mm, ri,0 (circles). The solid line indicates the best linear fit through ri,app – ri,0 , in this case corresponding to an imaged edge spacing of 0.09938 cm. The light colored area indicates the 68% confidence region corresponding to edge distances from 0.09925 cm to 0.09950 cm.

