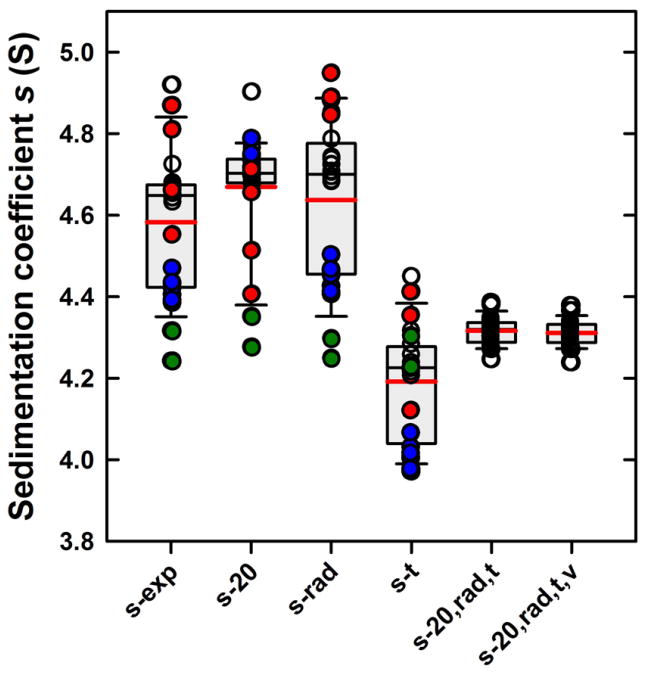
Figure 7.
Box-and-whisker plot (SigmaPlot) of the s-values before and after external calibration corrections. For each set, the size of the grey box represents the lower and upper quartiles (25th-75th percentile) of the data set (Table 1). The bold red line represents the mean and the thinner black line the median. Whiskers, calculated using the standard method, represent the 10th and 90th percentiles in the data. Outliers represent the remaining 20 percent of the data are shown individually. All data are shown as circles and bars are labeled as in Table 1: sexp for the experimental s-values prior to any corrections, s20 for the values corrected solely for temperature, srad for the values corrected solely for radial magnification errors, st for values subjected to scan time corrections, s20,rad,t for values corrected simultaneously for temperature, radial magnification, and scan times, and finally s20,rad,t,v further corrected for the absorbance finite scanning times . Data for Larry and Shemp, which show temperature extremes, are highlighted in red and blue, respectively. The latter instrument also shows the largest radial magnification errors. Data for Clotho with the smallest scan-time errors are shown in green.

