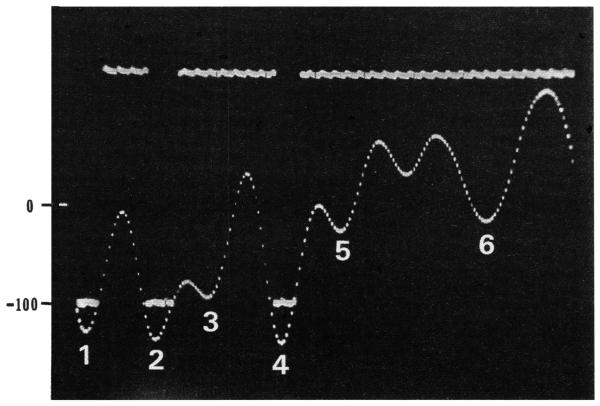
FIGURE 1.
Oscillographic trace showing an amplified neural waveform characterized by 3 successive voltage events that exceeded −100 mV. The corresponding level discriminator output pulses are show by horizontal bars at the −100 mV criterion level. Note that the trigger of the level discriminator was adjusted until its output pulse width exactly matched the width of the neural waveform at −100 mV (see peaks 1, 2 and 4). Neural voltage events under −100 mV (e.g., peaks 3 and 5-6) did not produce output pulses. The 0 and −100 mV levels are shown by numbers on the left. The full width of the trace spans 2 msec.

