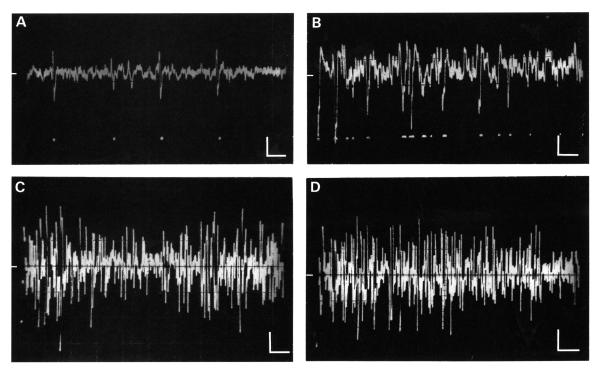
FIGURE 4.
A-B. Spontaneous activity characterized by voltage events from only a few different neurons. A. A normal animal; B. A tone-exposed animal. The higher incidence of voltage events shown in B was typical of records from tone-exposed animals. C-D. Spontaneous multiunit activity in a tone-exposed animal. In C, the voltage events occurred in spindle-like bursts; in D the burst of activity was followed by an interval of low amplitude activity. Recordings in A and B were obtained with a higher impedance electrode than those in C and D. In each frame the time axis was 10 ms/div and the amplitude axis 50 ms/div, as indicated by the calibration bars. The 0 voltage line is shown by the bar along the middle of the left margin of each panel.

