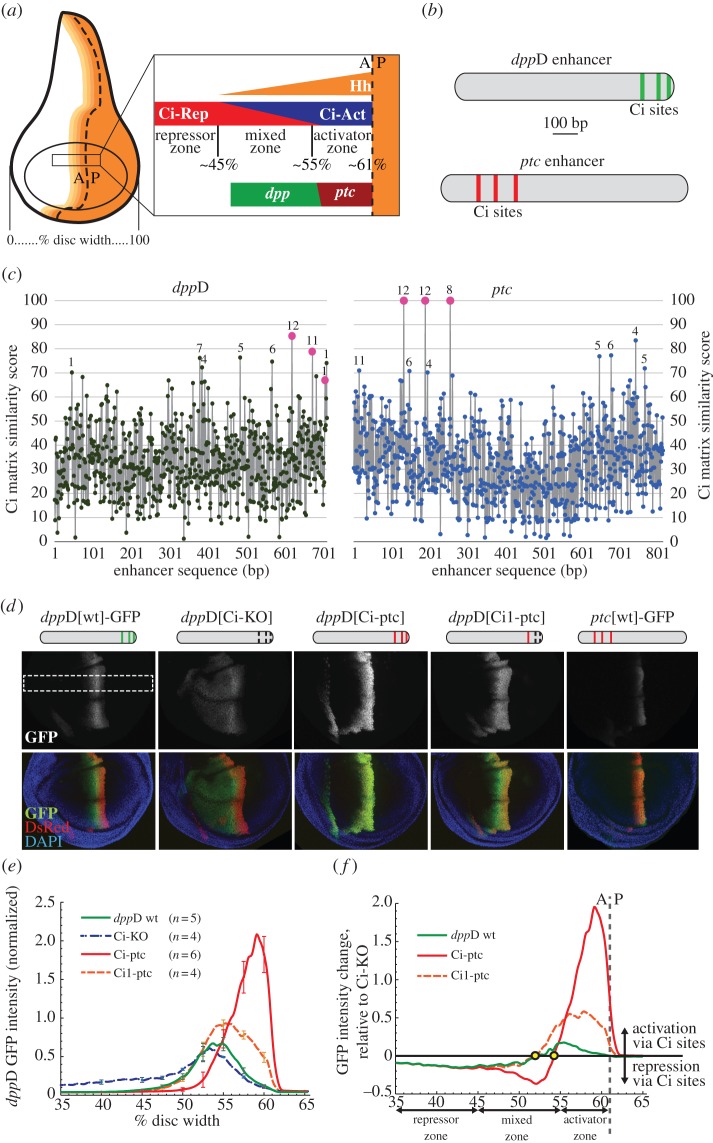
Figure 1.
The dppD enhancer requires conserved low-affinity Ci/Gli sites to respond optimally to Hh and Ci in the developing wing. (a) Diagram of the Drosophila third-instar wing imaginal disc, showing the distribution of the Hedgehog signalling gradient across the anterior compartment. The dashed line indicates the anterior–posterior (A/P) boundary separating posterior cells, which secrete Hh, from anterior cells, which express the Ci transcription factor. Magnification of a segment of the wing pouch across the compartment boundary shows distinct zones (repressor, mixed and activator) based on their distance from the source of Hh morphogen. The Hh target genes dpp and ptc respond differently to the gradient; dpp is expressed maximally in the mixed zone, whereas ptc expression is restricted to the activator zone. (b) Ci binding motifs in the dppD and ptc enhancers. (c) Estimated Ci binding affinity and evolutionary conservation across the dppD and ptc enhancers of D. melanogaster. Ci matrix similarity score (see Methods) was plotted for every 9-mer. Known or proposed Ci sites (table 1) are shown as larger dots. For each 9-mer with a score ≥70, numerals indicate the number of Drosophila species (out of 12) in which that sequence is present at or near the orthologous position. (d) Top: diagrams of dppD enhancer constructs, with defined Ci binding sites as vertical bars (broken bars indicate mutated sites). Middle and bottom, confocal images of third-instar larval wing imaginal discs, showing GFP expression driven by dppD-GFP or ptc-GFP reporter transgenes. Red fluorescence is driven by a dppD[Ci-ptc]-DsRed transgene used for GFP fluorescence normalization and positional reference [33]. In dppD[Ci-KO]-GFP, three Ci sites were destroyed by targeted mutation; in dppD[Ci-ptc]-GFP, three Ci sites were converted to optimal motifs taken from ptc; in dppD[Ci1-ptc]-GFP, the 5′ Ci site was optimized, whereas site 2 and 3 were destroyed. The white dashed rectangle indicates the section of the dorsal wing pouch that is measured in the following panels. (e) Normalized GFP fluorescence data collected from the dorsal section of the wing pouch. Error bars indicate 1 s.d. (f) Net effect of wild-type or high-affinity Ci sites on dppD expression (calculated as the normalized transgene expression of dppD[wt] or dppD[Ci-ptc] minus normalized dppD[Ci-KO] expression). Circles indicate the positions on the A/P axis at which Ci input switches from net activation to net repression for each enhancer. (Online version in colour.)

