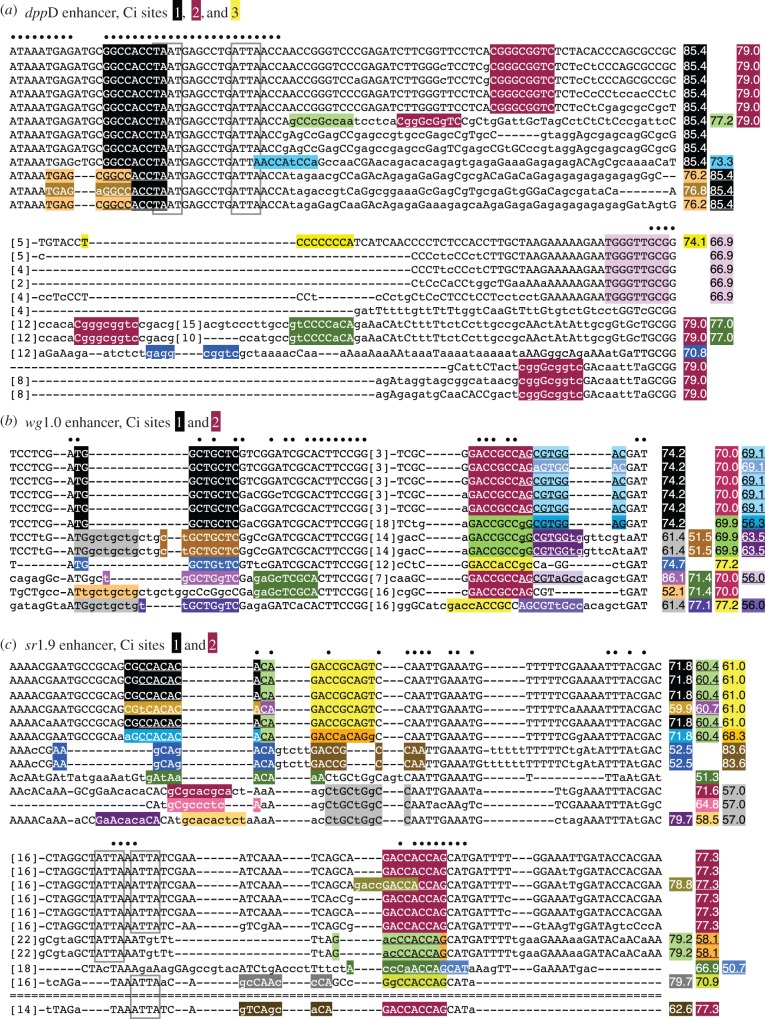
Figure 3.
Evolutionary conservation of predicted binding affinity, but not of sequence identity, at many low-to-moderate-affinity Ci binding sites. Twelve-species Drosophila sequence alignments are shown for selected regions of the (a) dppD, (b) wg1.0 and (c) sr1.9 enhancers. Selected 9-mers are shaded, and Ci matrix similarity scores for those motifs are shown to the right. Sequences are from the following Drosophila species, from top to bottom: D. melanogaster, D. simulans, D. sechellia, D. yakuba, D. erecta, D. ananassae, D. pseudoobscura, D. persimilis, D. willistoni, D. virilis, D. mojavensis and D. grimshawi. Dashes indicate gaps; double-dashes indicate a lack of alignable sequence. Bracketed numbers indicate the number of bases deleted at that position to conserve space. Conserved homeodomain binding motifs are in grey boxes. (Online version in colour.)

