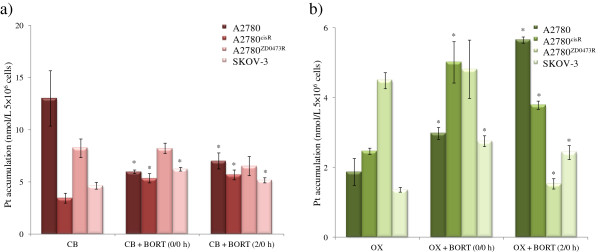
Figure 5.

Cellular platinum accumulation in ovarian cancer A2780 and A2780cisR, A2780ZD0473R and SKOV-3 cell lines as applied to single treatments of CB and OX and their selected combinations with BORT. Cells were treated with the drugs for 24 h followed by collection, lysis and finally the detection of Pt was using AAS. Data were statistically analyzed using the paired Student’s t test: * p <0.05 indicates significant difference from control. Error bars represent the standard deviation.
