
Figure 7.
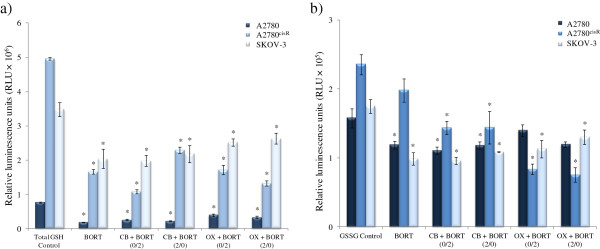
Levels of reduced (GSH) and oxidized (GSSG) forms of cellular glutathione in relative luminescence units (RLU × 105) before and after treatments with BORT alone and its combination with CB and OX in the ovarian cancer A2780, A2780cisR and SKOV-3 cell lines. Cells were treated for 24 h and glutathione content was determined using GSH/GSSG-Glo Assay kit. Data were statistically analyzed using the paired Student’s t test: * p <0.05 indicates significant difference from control. Error bars represent the standard deviation.